When people ask, “𝐻𝑜𝑤 𝑖𝑠 𝑡ℎ𝑒 𝐷𝑒𝑛𝑣𝑒𝑟 𝑚𝑎𝑟𝑘𝑒𝑡 𝑑𝑜𝑖𝑛𝑔?” they usually expect a single number. But as someone that closely looks at the data, I know that one number only tells half the story.
To understand the “𝗠𝗮𝗿𝗸𝗲𝘁 𝗘𝗻𝗴𝗶𝗻𝗲,” you have to look at two specific forces:
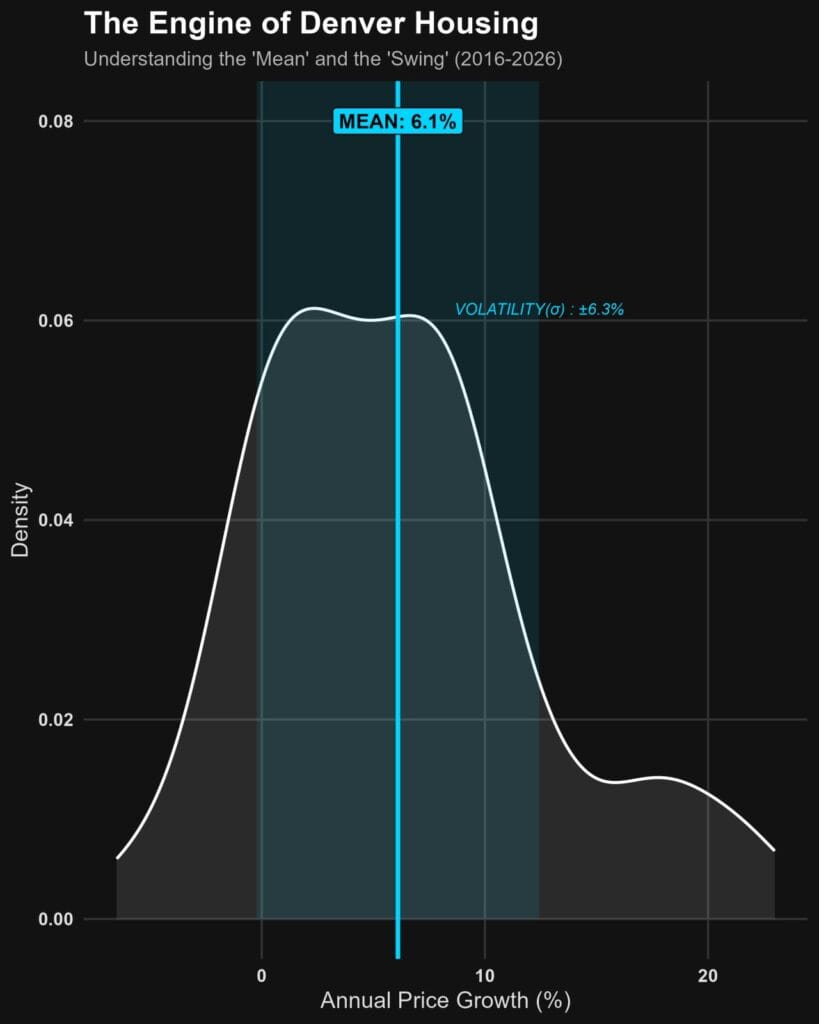
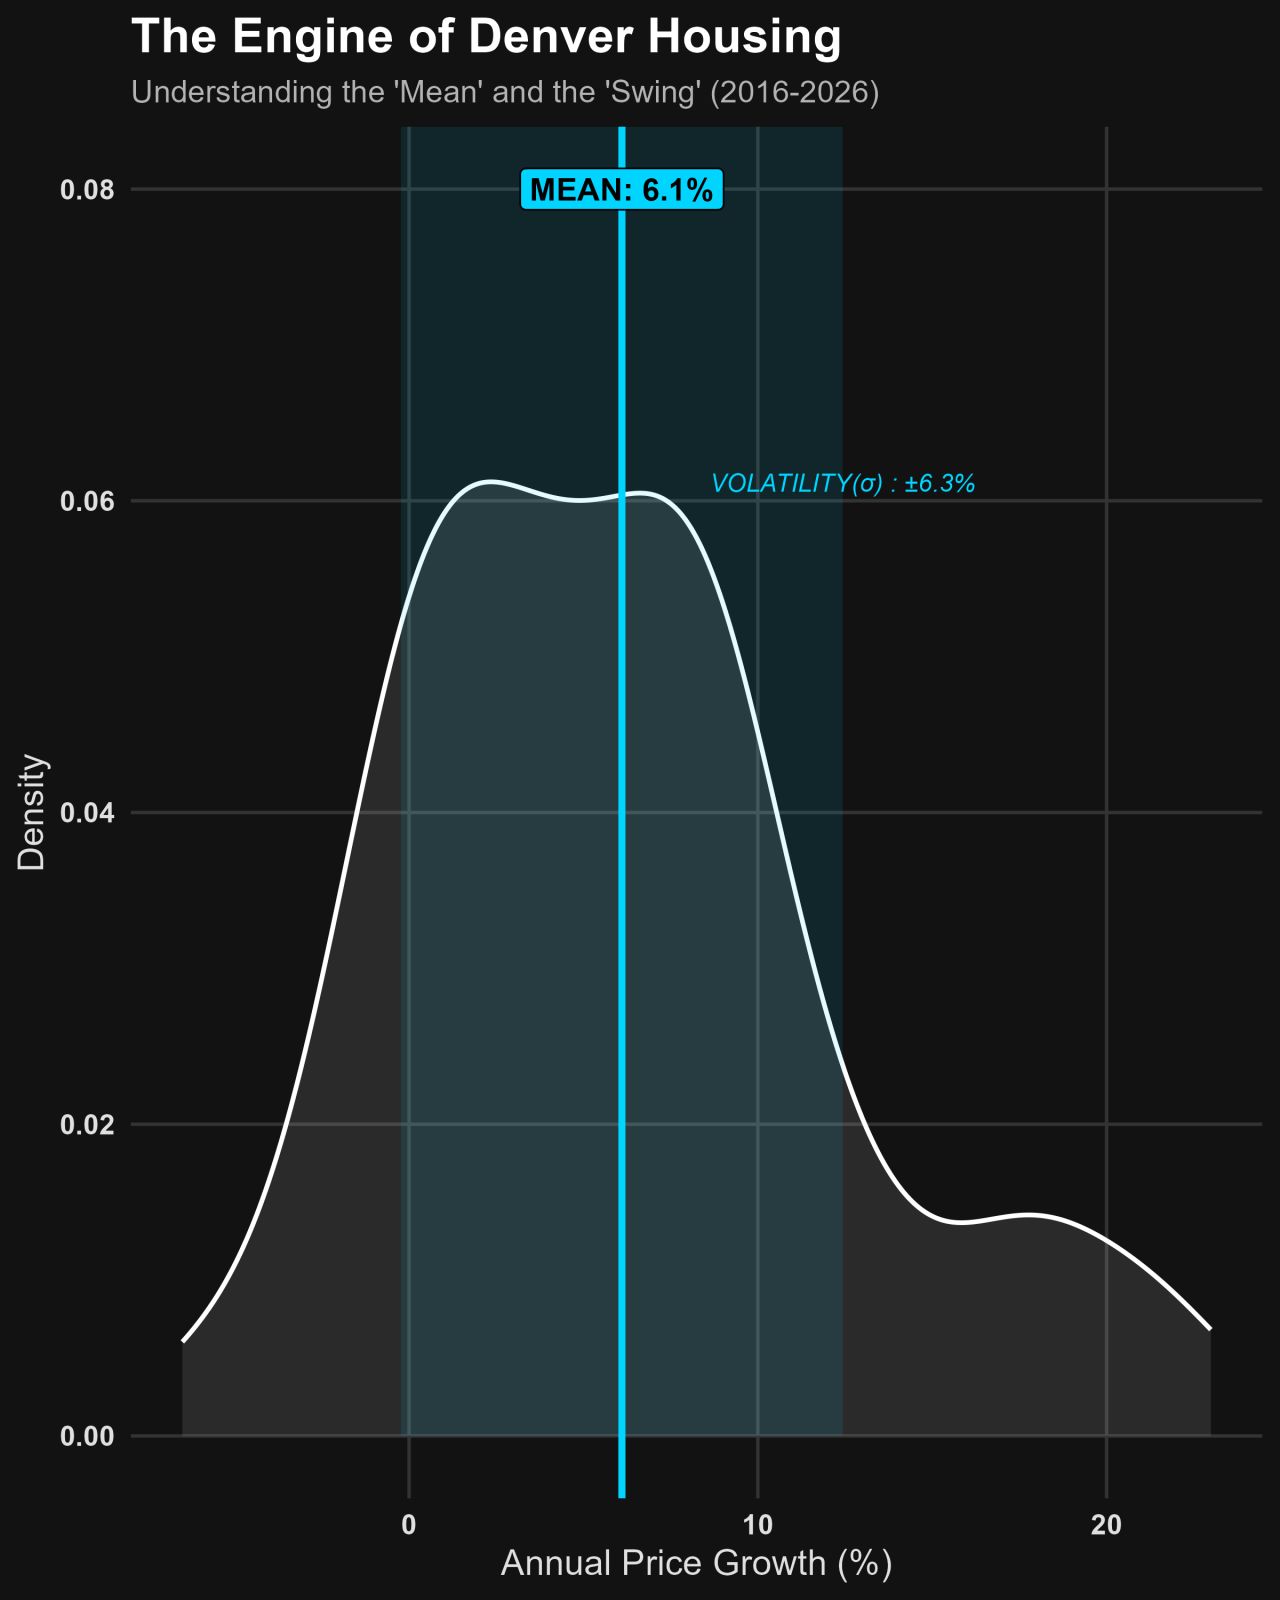
1. 𝗧𝗵𝗲 𝗠𝗲𝗮𝗻 (The Anchor): 𝟲.𝟭% This is the average upward “drift” of the Denver market over the last decade. Even when the market gets wild, it eventually tries to return to this center point. If you’re a long-term buy-and-hold investor, this is your baseline expectation.
2. 𝗧𝗵𝗲 𝗩𝗼𝗹𝗮𝘁𝗶𝗹𝗶𝘁𝘆 (The Swing): ±𝟲.𝟯% This is the “wind” that pushes us away from the average. Real estate isn’t a straight line; it’s a series of swings. A volatility of 6.3% means that in any given year, it is perfectly “normal” to see growth fluctuate between -0.2% and +12.4%.
Most people fear volatility, but for the smart investor, volatility is brings opportunity. When the “Swing” pushes us below the mean, it’s often a buying opportunity. When it pushes us far above, it’s a window for massive equity gains.
Don’t just watch the average. Watch the engine.