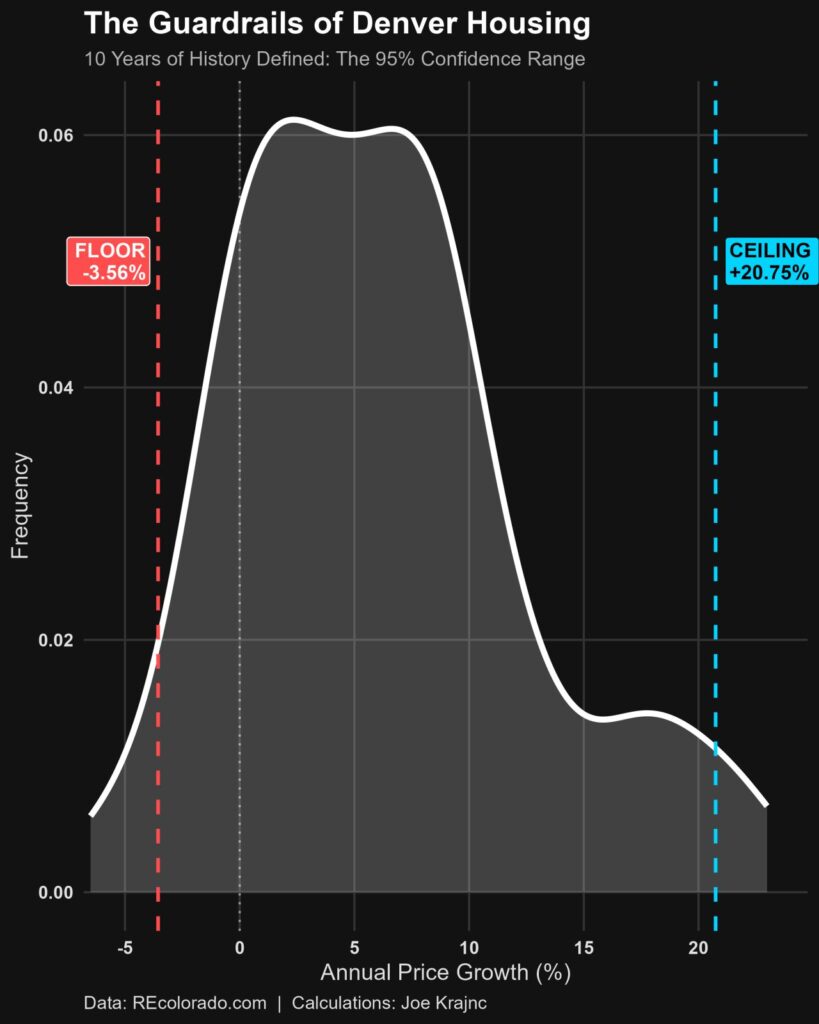
In my last post I explained the Mean and Volatility of the Denver Housing market. The underlying assumption was that volatility has a normal distribution. Below, you’ll see the actual right-skewed distribution, and you can see that in 95% of historical scenarios Denver hasn’t broken lower than -3.56% or peaked above +20.75%.
If you’re a homeowner or investor, these are the only two numbers that truly define your long-term risk.