I put 10 years of Denver Metro housing data through a Random Forest machine learning model – 24 market variables – to find out.
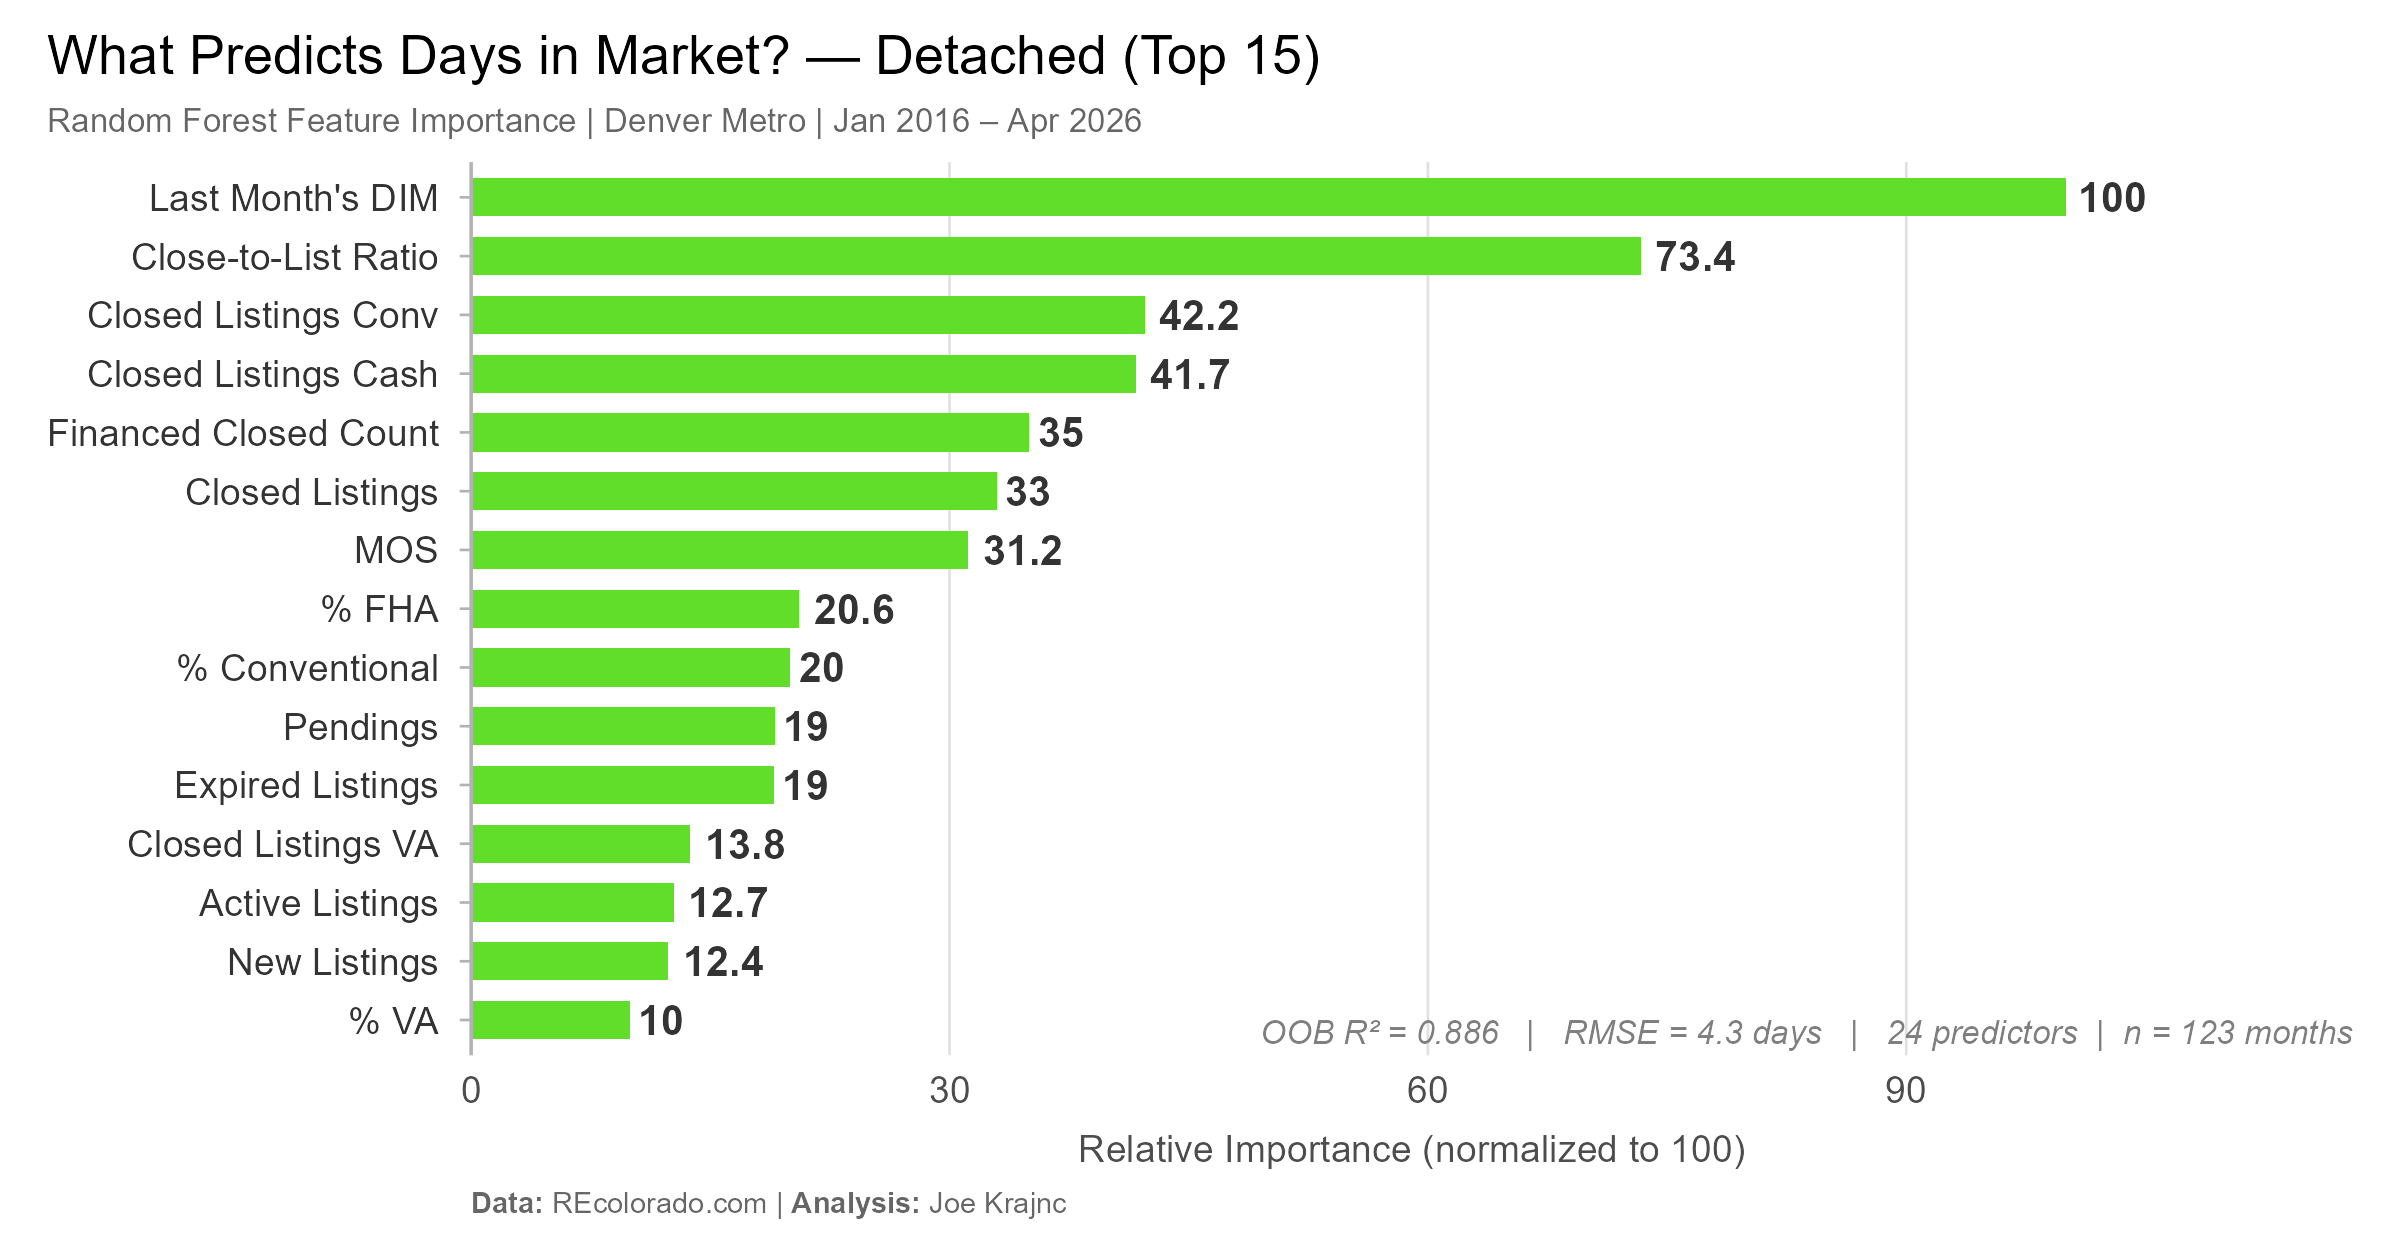
The model explained 88.6% of the variation in DIM with an average error of just 4.3 days.
𝗛𝗲𝗿𝗲’𝘀 𝘄𝗵𝗮𝘁 𝗿𝗼𝘀𝗲 𝘁𝗼 𝘁𝗵𝗲 𝘁𝗼𝗽:
𝗟𝗮𝘀𝘁 𝗺𝗼𝗻𝘁𝗵’𝘀 𝗗𝗮𝘆𝘀 𝗶𝗻 𝗠𝗮𝗿𝗸𝗲𝘁 – the market moves in momentum, not sudden shifts
𝗖𝗹𝗼𝘀𝗲-𝘁𝗼-𝗟𝗶𝘀𝘁 𝗥𝗮𝘁𝗶𝗼 – when buyers stop bidding aggressively, homes sit. Pretty simple.
𝗥𝗼𝘂𝗻𝗱𝗶𝗻𝗴 𝗼𝘂𝘁 𝘁𝗵𝗲 𝘁𝗼𝗽 𝟱: transaction volume by financing type. How many homes are actually closing — and how buyers are paying — carries more weight than you might expect.
𝐻𝑒𝑟𝑒’𝑠 𝑤ℎ𝑦 𝑡ℎ𝑎𝑡 𝑚𝑎𝑡𝑡𝑒𝑟𝑠:
Cash buyers skip appraisal contingencies entirely and close fastest. Conventional buyers are financially stronger and close with less friction. When both are active, the market is confident and liquid — homes move.
When those numbers fall, friction rises. More FHA and VA transactions mean stricter appraisals, longer underwriting, and more deal fallouts. Homes sit longer – not because of price, but because of transaction complexity.
The model is reading financing mix as a proxy for market confidence and buyer quality. That signal is powerful.
𝗔𝗻𝗱 𝘄𝗵𝗮𝘁 𝗯𝗮𝗿𝗲𝗹𝘆 𝗺𝗼𝘃𝗲𝗱 𝘁𝗵𝗲 𝗻𝗲𝗲𝗱𝗹𝗲?
𝗠𝗲𝗱𝗶𝗮𝗻 𝗖𝗹𝗼𝘀𝗲𝗱 𝗣𝗿𝗶𝗰𝗲
𝗣𝗿𝗶𝗰𝗲 𝗽𝗲𝗿 𝗦𝗾𝘂𝗮𝗿𝗲 𝗙𝗼𝗼𝘁
Price alone doesn’t predict how long a home sits. The conditions surrounding the price do.
𝗙𝗼𝗿 𝗯𝘂𝘆𝗲𝗿𝘀: watch the Close-to-List Ratio. When it starts dropping, you have more negotiating room.
𝗙𝗼𝗿 𝘀𝗲𝗹𝗹𝗲𝗿𝘀: the market’s current momentum matters more than your list price. Timing and positioning are everything.
Denver Metro (SMDRA) | 10 years of data | 89.5% model accuracy


