Not inventory. Not days on market. Not how many homes are closing.
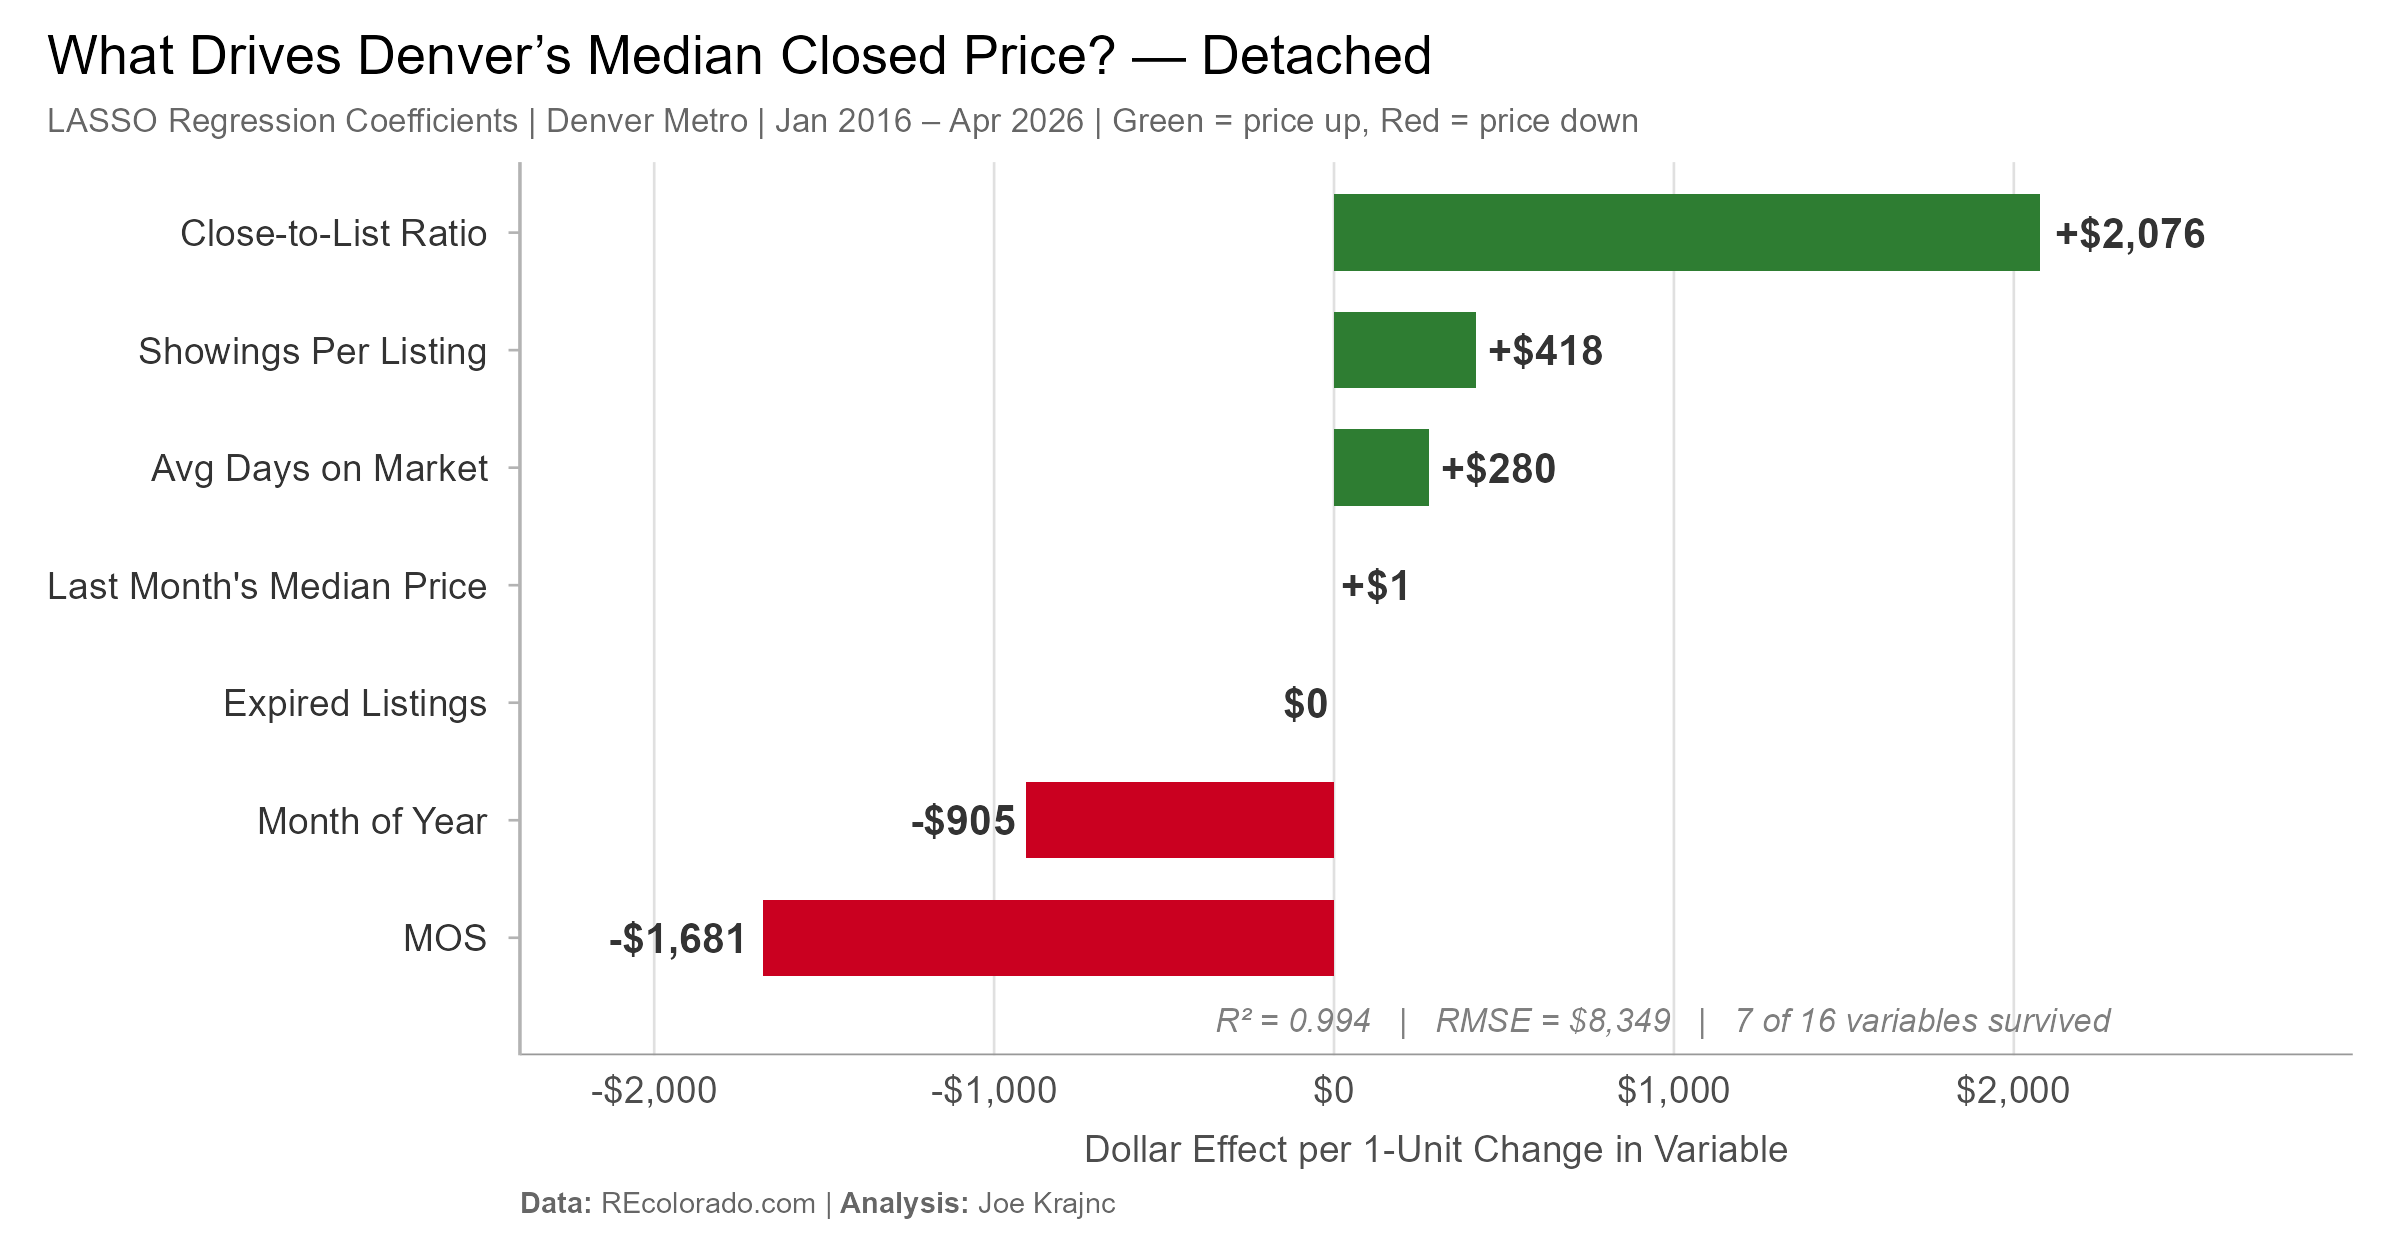
It’s the Close-to-List Ratio — a measure of how aggressively buyers are bidding relative to list price. For each percentage point shift in buyer bidding behavior, median price moves by $2,076.
That’s the top finding from a LASSO regression model I ran on 10 years of Denver Metro housing data. LASSO is a machine learning technique that forces variables to earn their place – shrinking irrelevant ones to exactly zero. Of 16 market variables tested, only 7 survived.
The rest of the top findings:
✅ Showings per Listing (+$418) – more buyer interest per home pushes prices higher. Demand intensity matters.
✅ Months of Supply (-$1,681) – every additional month of inventory is associated with $1,681 lower median price.
𝗪𝗵𝗮𝘁 𝗴𝗼𝘁 𝗰𝘂𝘁 𝗲𝗻𝘁𝗶𝗿𝗲𝗹𝘆?
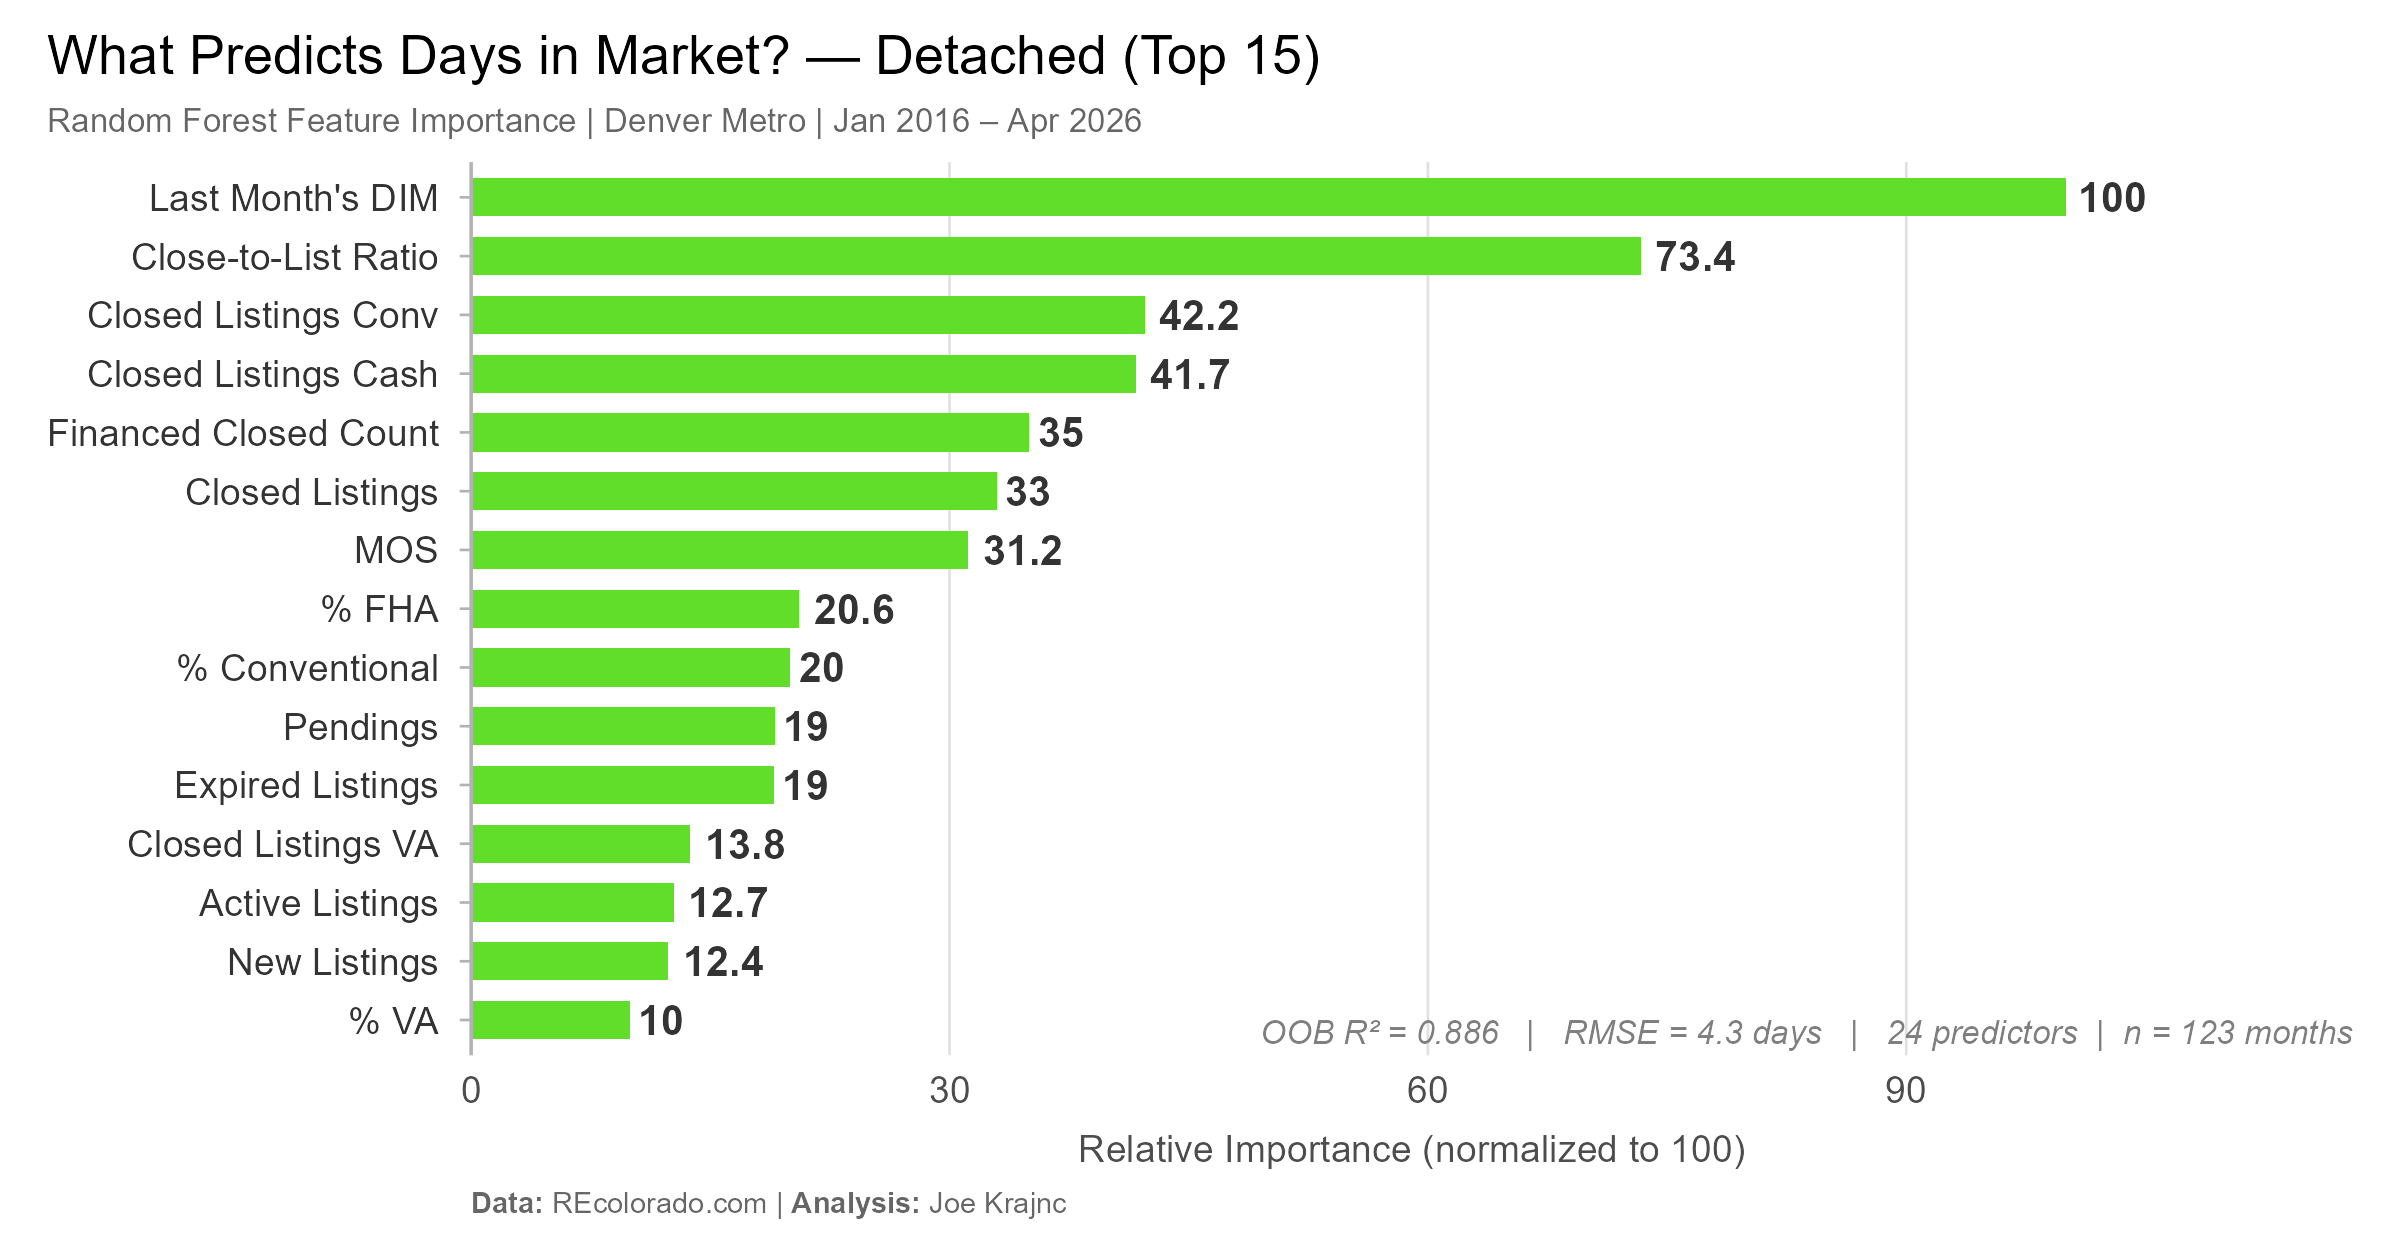
Transaction volume. Financing counts. Active listings. New listings. Pendings. All eliminated as noise once buyer aggression and supply are in the model.
𝗧𝗵𝗲 𝘁𝗮𝗸𝗲𝗮𝘄𝗮𝘆: home prices in Denver rise when buyers compete hard and fall when supply gives them room to breathe. Everything else is a distraction.
Watch the Close-to-List Ratio. It’s telling you where prices are headed before they get there.
Model accuracy: R² = 0.994 | Average error = $8,349 on a $660K median market
📍 Denver Metro | Jan 2016 – Apr 2026