𝗧𝗵𝗲 𝗗𝗲𝗻𝘃𝗲𝗿 𝗛𝗼𝘂𝘀𝗶𝗻𝗴 𝗠𝗮𝗿𝗸𝗲𝘁 𝗛𝗮𝘀 𝗧𝘄𝗼 𝗚𝗲𝗮𝗿𝘀. 𝗪𝗵𝗶𝗰𝗵 𝗢𝗻𝗲 𝗔𝗿𝗲 𝗬𝗼𝘂 𝗜𝗻? ⚙️🏘️
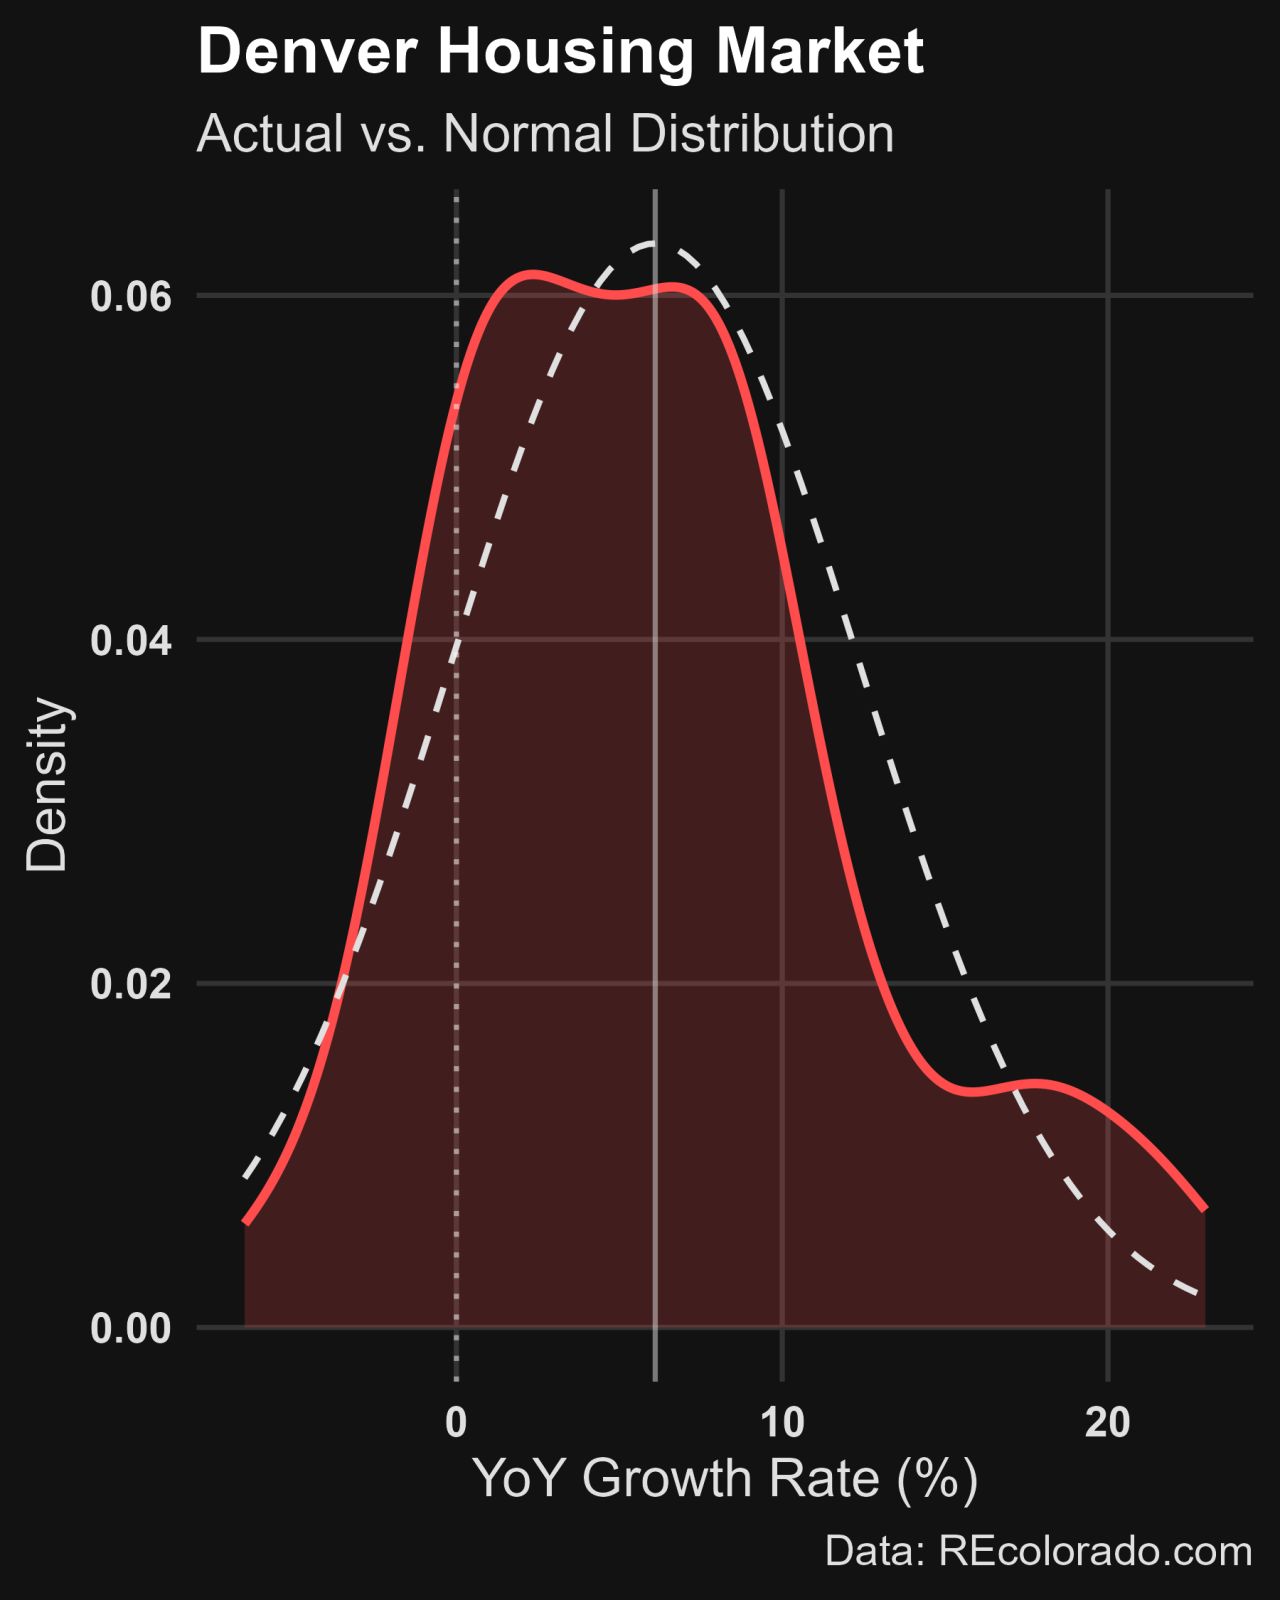
When I analyzed the last 10 years of Denver housing data, the overall market distribution looked strange—it was a flat, messy plateau.
In statistics, that’s a red flag. It usually means you’re looking at two different things pretending to be one.
So, I split the data by property type (Detached vs. Attached). The result? The “hidden” structure of our market was revealed.
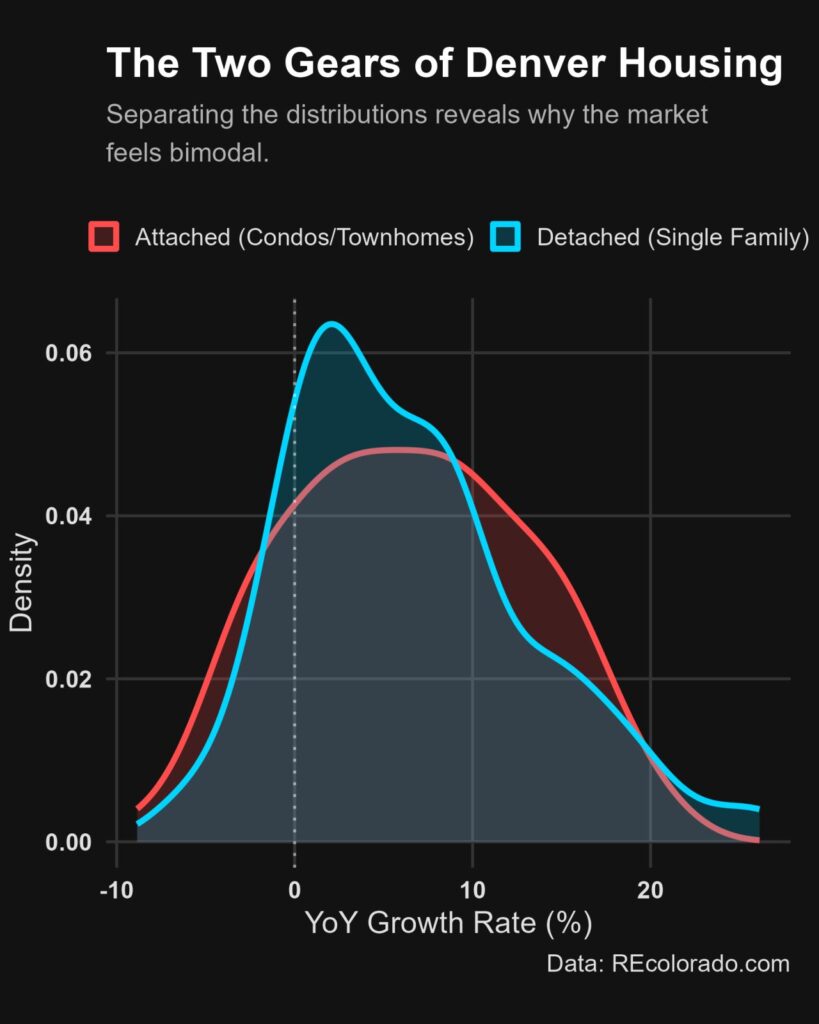
𝗧𝗵𝗲 𝗧𝗮𝗹𝗲 𝗼𝗳 𝗧𝘄𝗼 𝗗𝗶𝘀𝘁𝗿𝗶𝗯𝘂𝘁𝗶𝗼𝗻𝘀:
🔵 𝐷𝑒𝑡𝑎𝑐ℎ𝑒𝑑 𝐻𝑜𝑚𝑒𝑠 (The High-Beta Gear): Single-family homes are the drivers of Denver’s “upside surprise.” The distribution is heavily right-skewed (0.72). This means they capture the massive appreciation spikes during boom cycles. They have a “high ceiling,” but that comes with higher volatility.
🔴 𝐴𝑡𝑡𝑎𝑐ℎ𝑒𝑑 𝐻𝑜𝑚𝑒𝑠 (The Steady Gear): Condos and townhomes follow a remarkably symmetrical distribution (Skew: 0.04). It’s almost a perfect bell curve. This is the “Stable” asset. It doesn’t hit the 20% growth peaks of detached homes, but it orbits its median with much more predictability.
𝗪𝗵𝘆 𝘁𝗵𝗶𝘀 𝗺𝗮𝘁𝘁𝗲𝗿𝘀 𝗳𝗼𝗿 𝘆𝗼𝘂:
If you only look at the “Market Average,” you’re making decisions based on a blend that doesn’t actually exist.
𝐼𝑛𝑣𝑒𝑠𝑡𝑜𝑟𝑠: Are you looking for the “Fat Tail” growth of a detached property, or the “Normal” consistency of an attached unit?
𝐻𝑜𝑚𝑒𝑜𝑤𝑛𝑒𝑟𝑠: Your “equity velocity” depends entirely on which distribution curve you live on.
𝑇ℎ𝑒 𝐷𝑎𝑡𝑎 𝑆𝑐𝑖𝑒𝑛𝑡𝑖𝑠𝑡’𝑠 𝑇𝑎𝑘𝑒:
Stop looking at “The Market”. Start looking at the structure. In Denver, we aren’t just seeing one housing market; we’re seeing two distinct financial regimes running in parallel.