Back in March, I attended a presentation at SMDRA by Colorado State Demographer, Kate Watkins, Ph.D. Between the talk of falling fertility rates and aging populations, one slide stood out to me: the 𝗛𝗼𝘂𝘀𝗶𝗻𝗴 𝗔𝗳𝗳𝗼𝗿𝗱𝗮𝗯𝗶𝗹𝗶𝘁𝘆 𝗜𝗻𝗱𝗲𝘅.
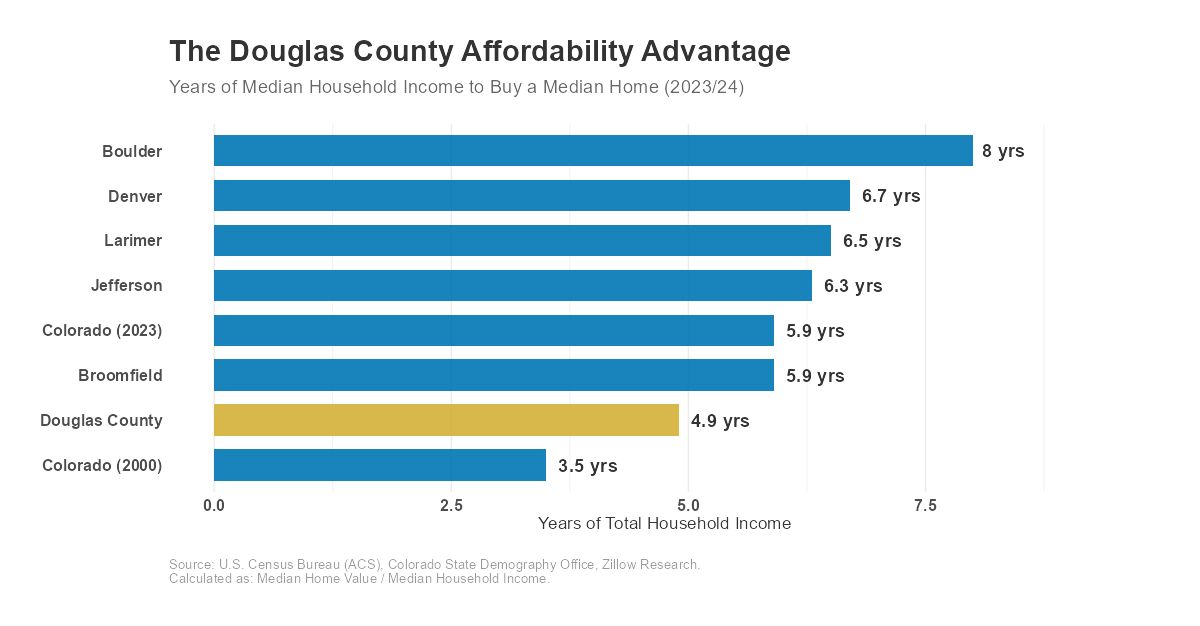
Kate shared that in 2000, it took just 𝟯.𝟱 𝘆𝗲𝗮𝗿𝘀 of median income to buy a home in Colorado. Today, that state-wide average has climbed to 𝟱.𝟵 𝘆𝗲𝗮𝗿𝘀.
But here is the insider math for my Douglas County folks:
Because our median household income is among the highest in the country ($144k+), our local affordability ratio actually sits at 4.9 years. That makes Douglas County a massive outlier compared to Denver (6.7) or Boulder (8.0). We have more “income-to-value” than almost anywhere else in the Front Range.
𝗧𝗵𝗲 𝗪𝗮𝗿𝗻𝗶𝗻𝗴: We can’t ignore the supply side. Douglas County just saw a 44.3% drop in building permits year-over-year. We are heading toward a significant inventory drought. When the next wave of buyers hits this wall of low supply, that 4.9 ratio is going to climb fast.
𝗠𝘆 𝗧𝗮𝗸𝗲: The “wait for lower rates” strategy is often a gamble against the hard math of supply and demand. In Douglas County, the window of relative affordability is open—but with production cratering, it won’t stay this way forever.