Feb. 2020 was the final pre-pandemic month so let’s compare it to Feb. 2026.
SMDRA* Active Listings Vs Pending:
𝗬𝗲𝗮𝗿 | 𝟮𝟬𝟮𝟬 | 𝟮𝟬𝟮𝟲 |
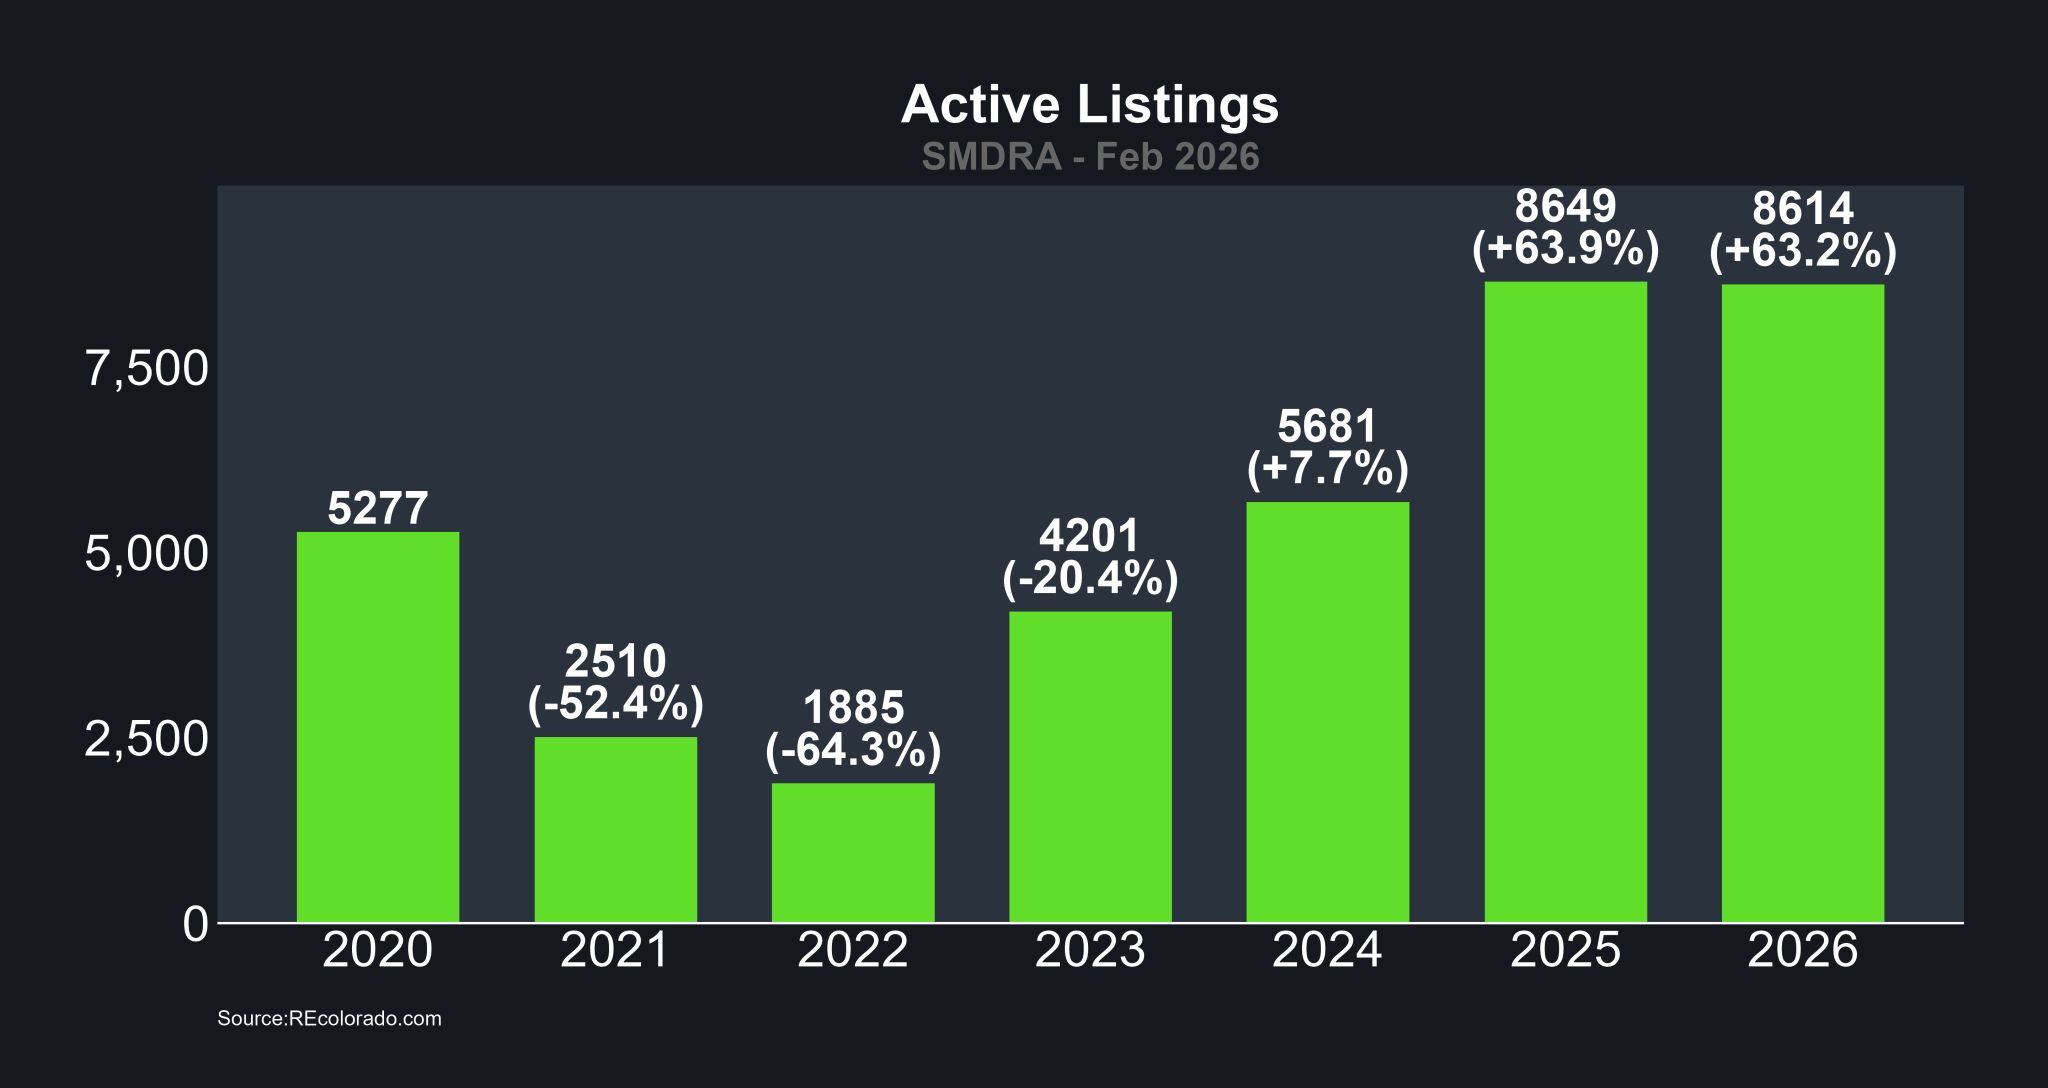
𝗔𝗰𝘁𝗶𝘃𝗲𝘀 | 5277 | 8614 | +63.2%
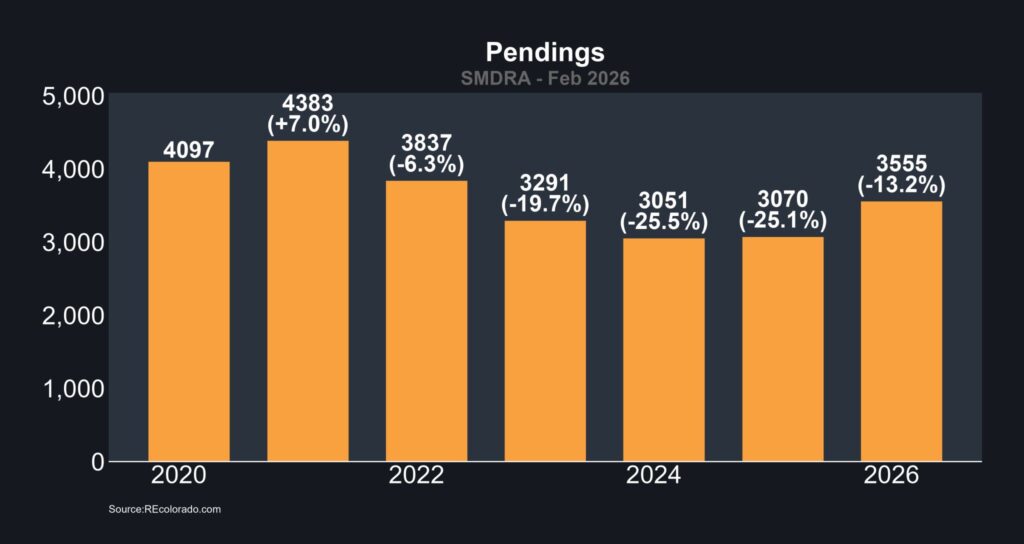
𝗣𝗲𝗻𝗱𝗶𝗻𝗴𝘀 | 4097 | 3555 | -13.2%
So Supply is way 𝗨𝗣, and Demand is 𝗗𝗢𝗪𝗡. I’m not loving this relationship.
*(Adams, Arapahoe, Broomfield, Denver, Douglas, Elbert, Jefferson)
Charts below:
Green is Actives
Orange is Pendings
Each bars % label is referenced back to Feb. 2020.