
The attached home market in Denver is quietly hollowing out in the middle.
Last week I showed you detached homes bifurcating upward – $1M+ claiming a bigger share every year. The attached market tells a completely different story.

Last week I showed you detached homes bifurcating upward – $1M+ claiming a bigger share every year. The attached market tells a completely different story.

I analyzed price bracket distribution across 4 consecutive Mays (2023-2026) for South Metro Denver detached homes. Here’s what stood out: The top is growing. $1M+
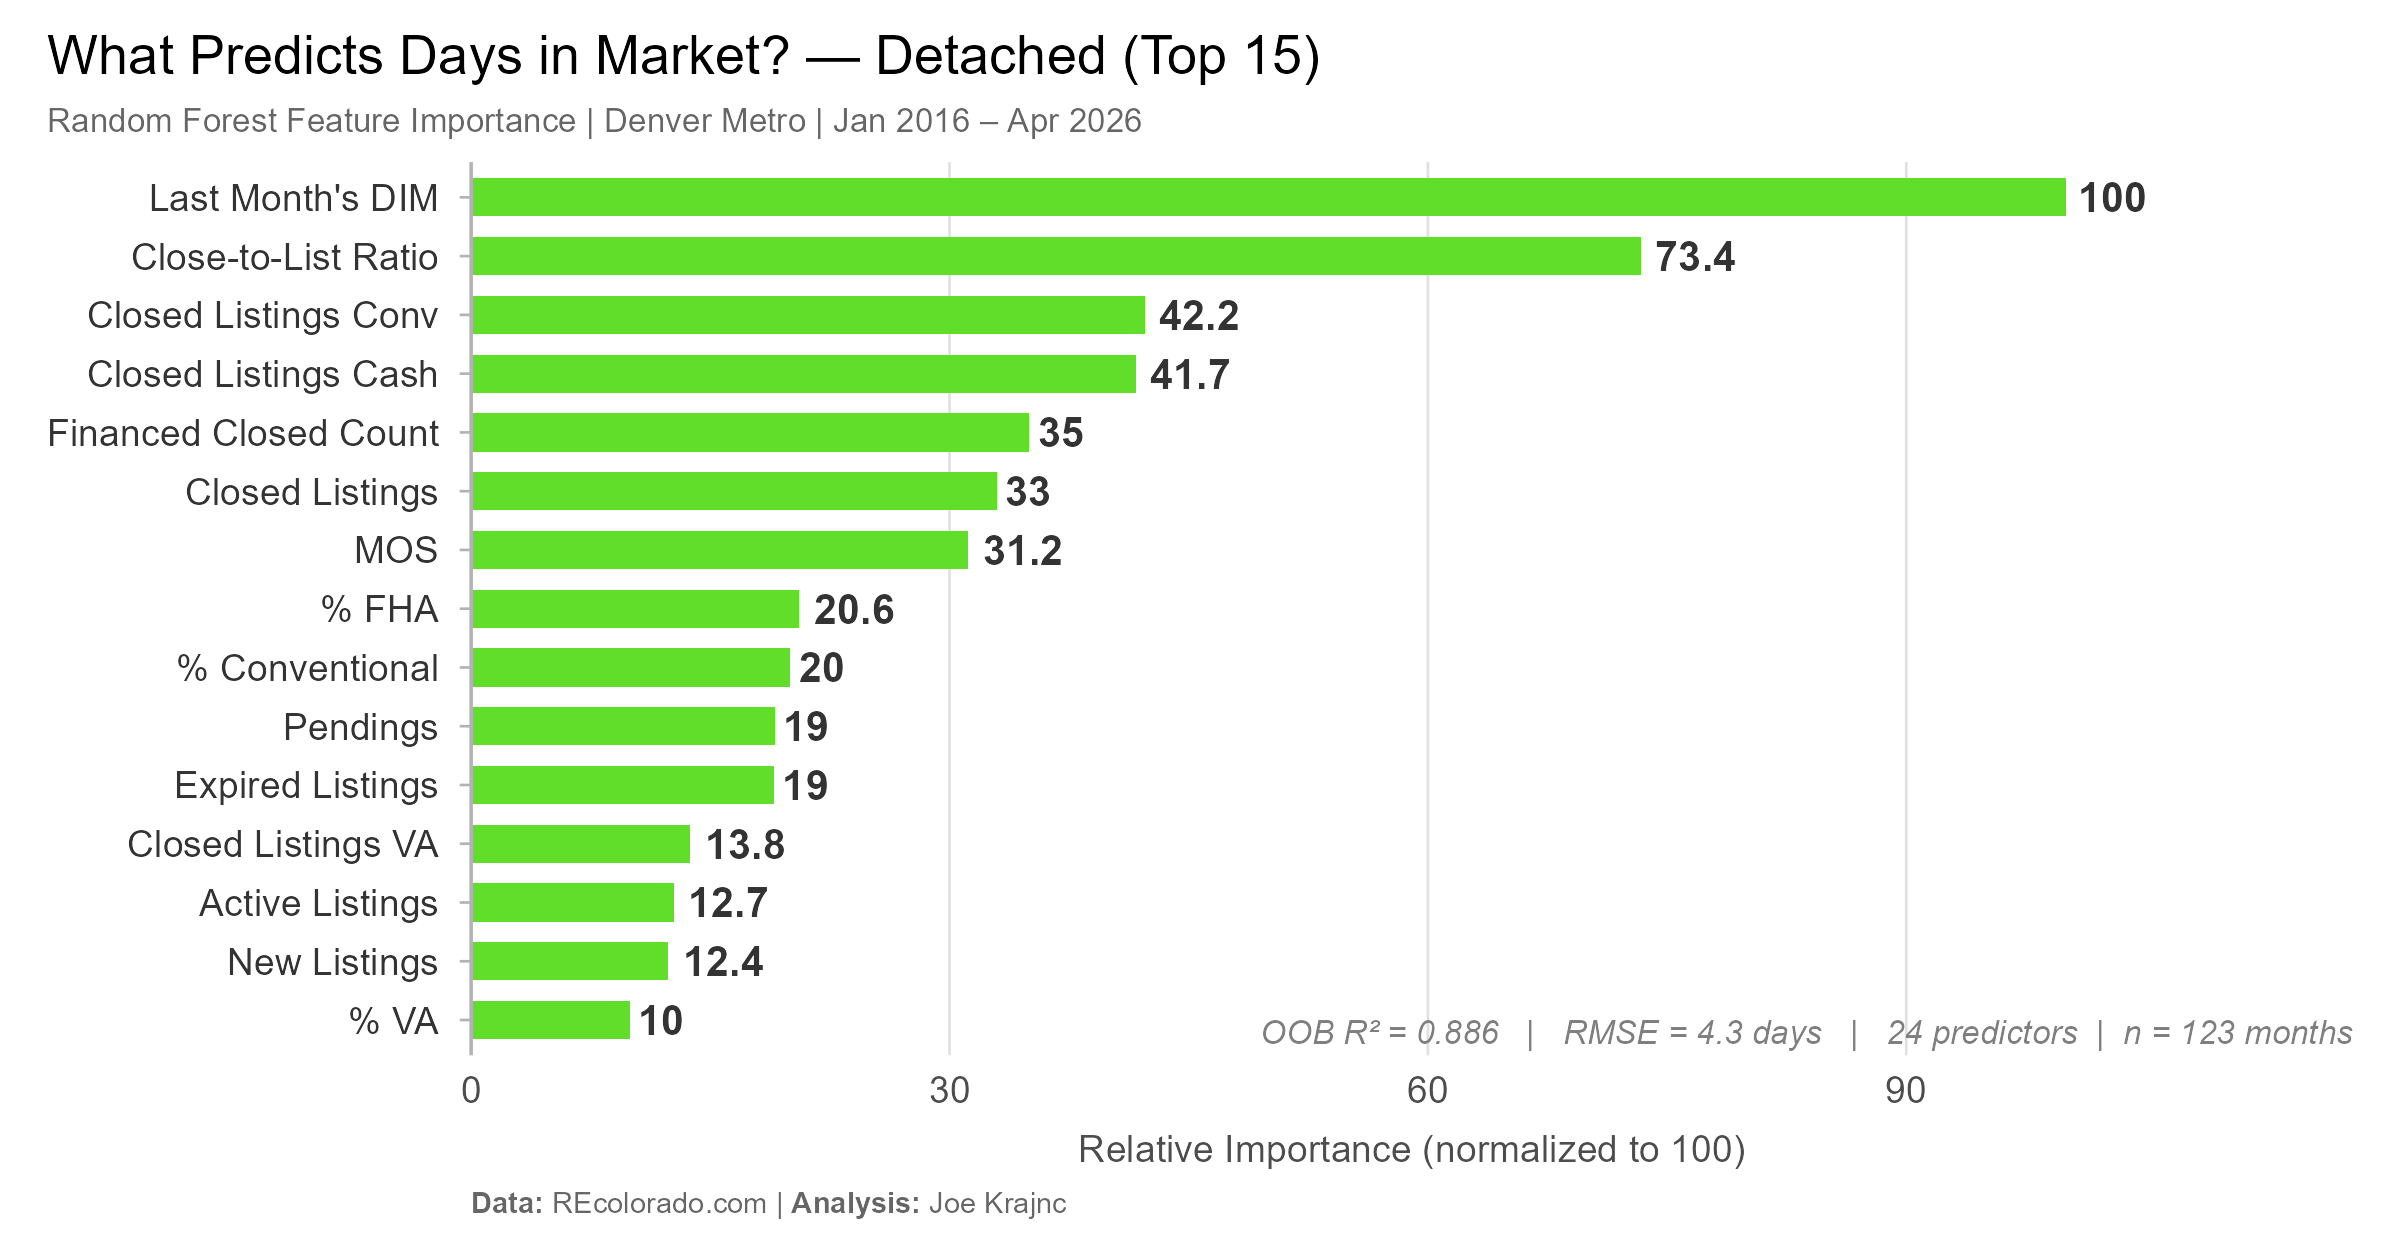
I put 10 years of Denver Metro housing data through a Random Forest machine learning model – 24 market variables – to find out.The model
Not inventory. Not days on market. Not how many homes are closing. It’s the Close-to-List Ratio — a measure of how aggressively buyers are bidding
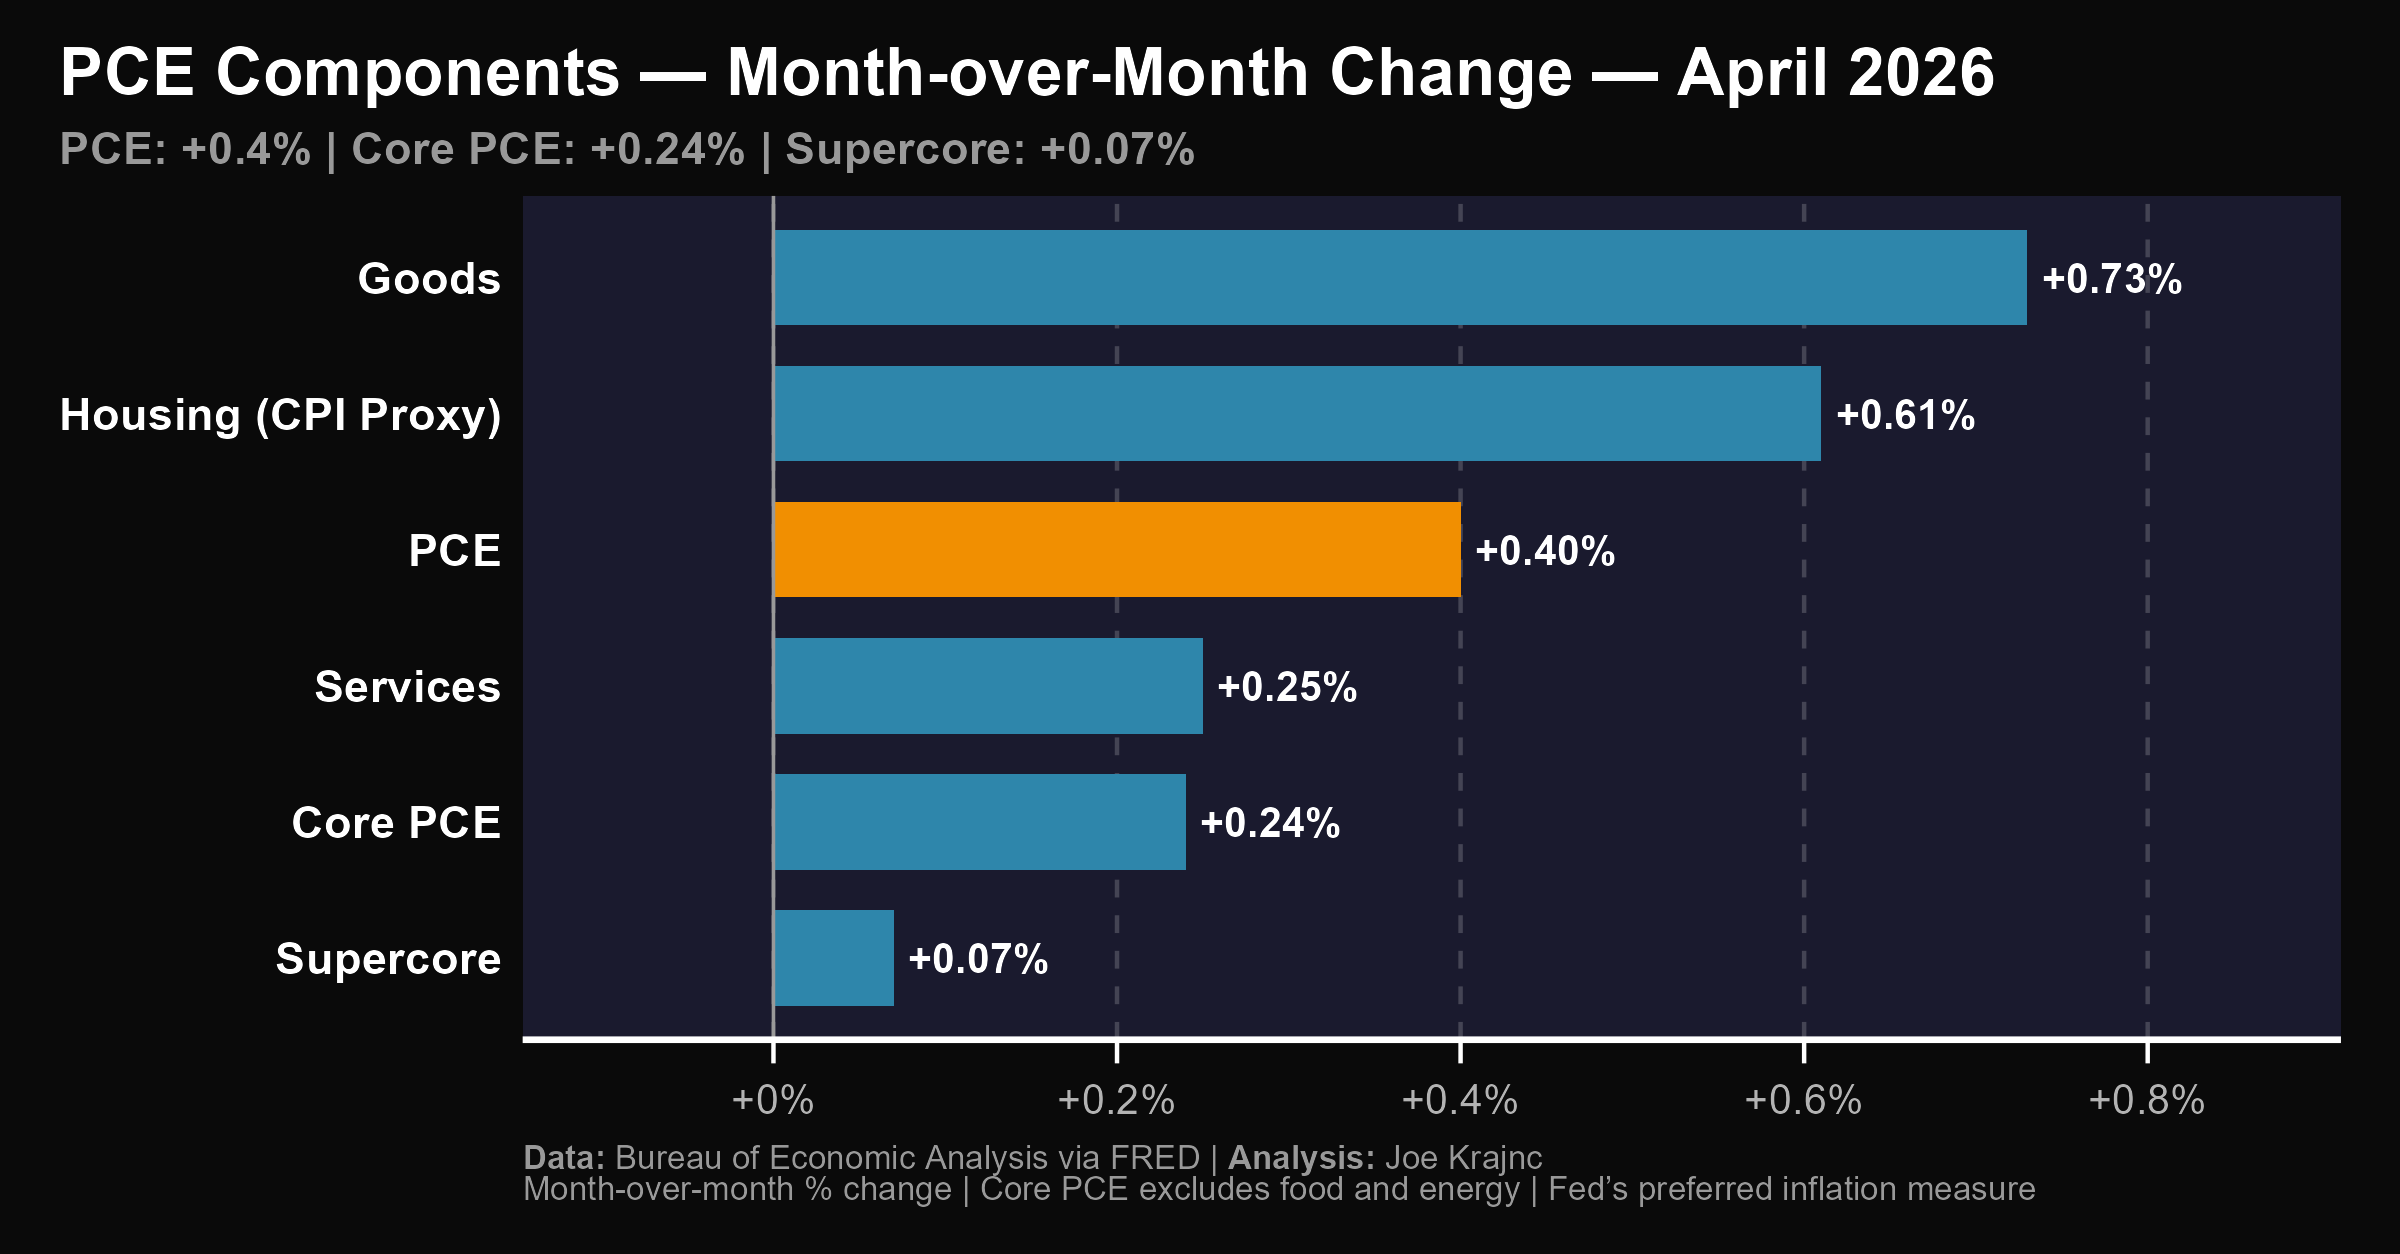
The Personal Income & Outlays report hit this morning. Most people call it the “PCE report” but it’s actually much broader – it tracks income,

PPI feeds into construction costs (materials, labor, transport)Construction cost inflation → new home prices stay elevatedElevated new home prices → resale prices get a floorServices
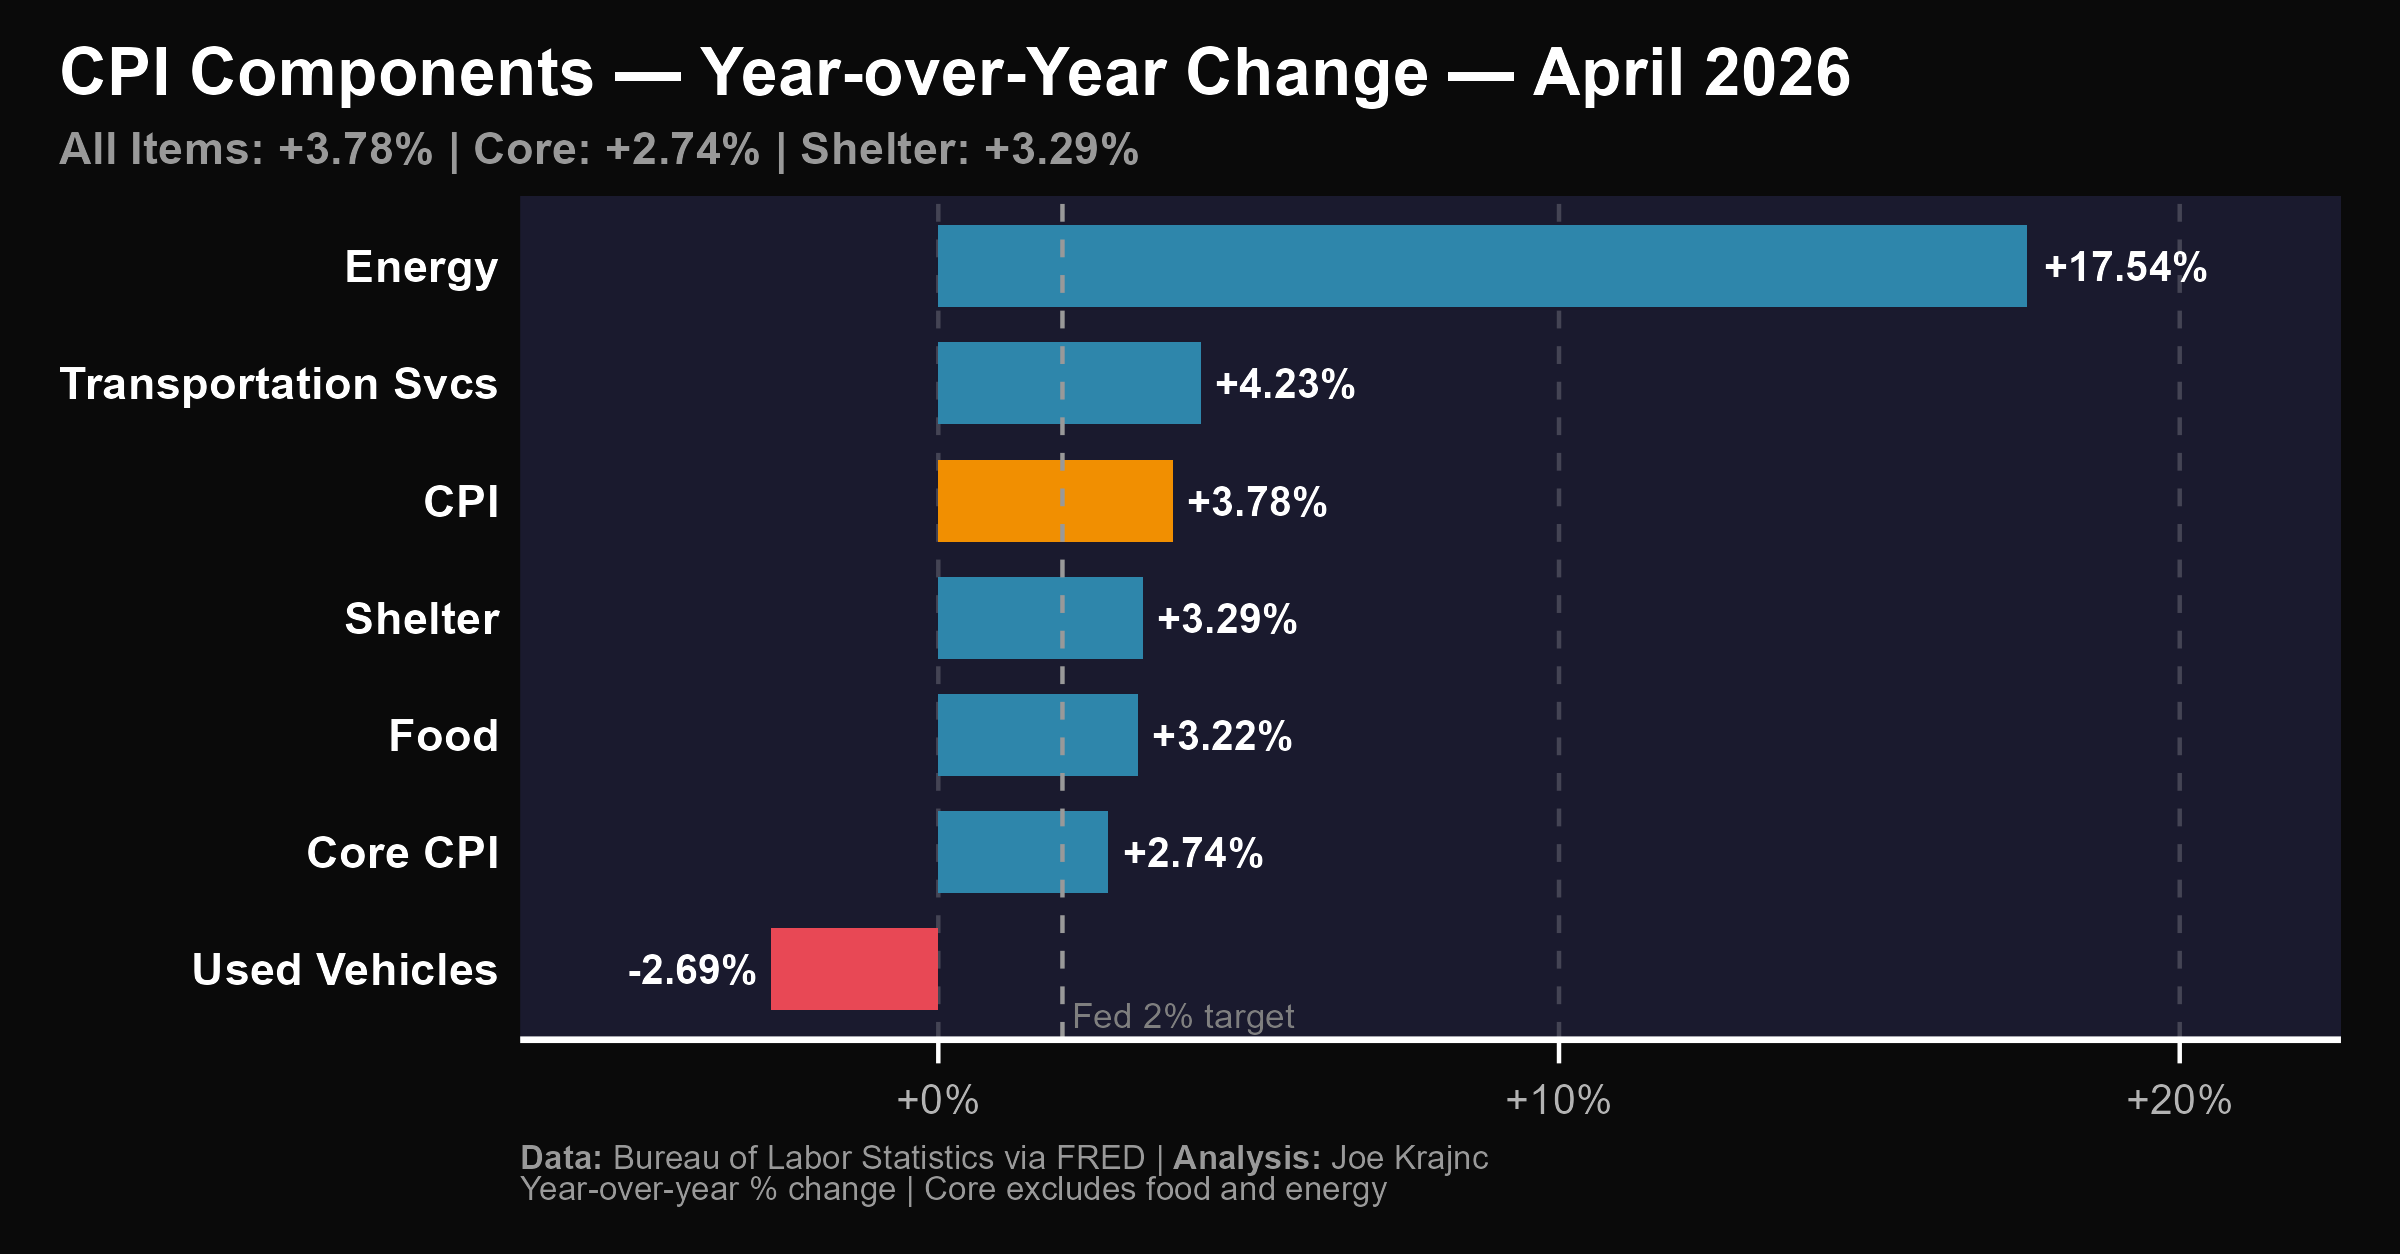
Headline CPI came in at +3.78% year-over-year. But the components tell a more nuanced story: 🔴 What’s pushing inflation UP:• Gasoline: +28.4% — the single
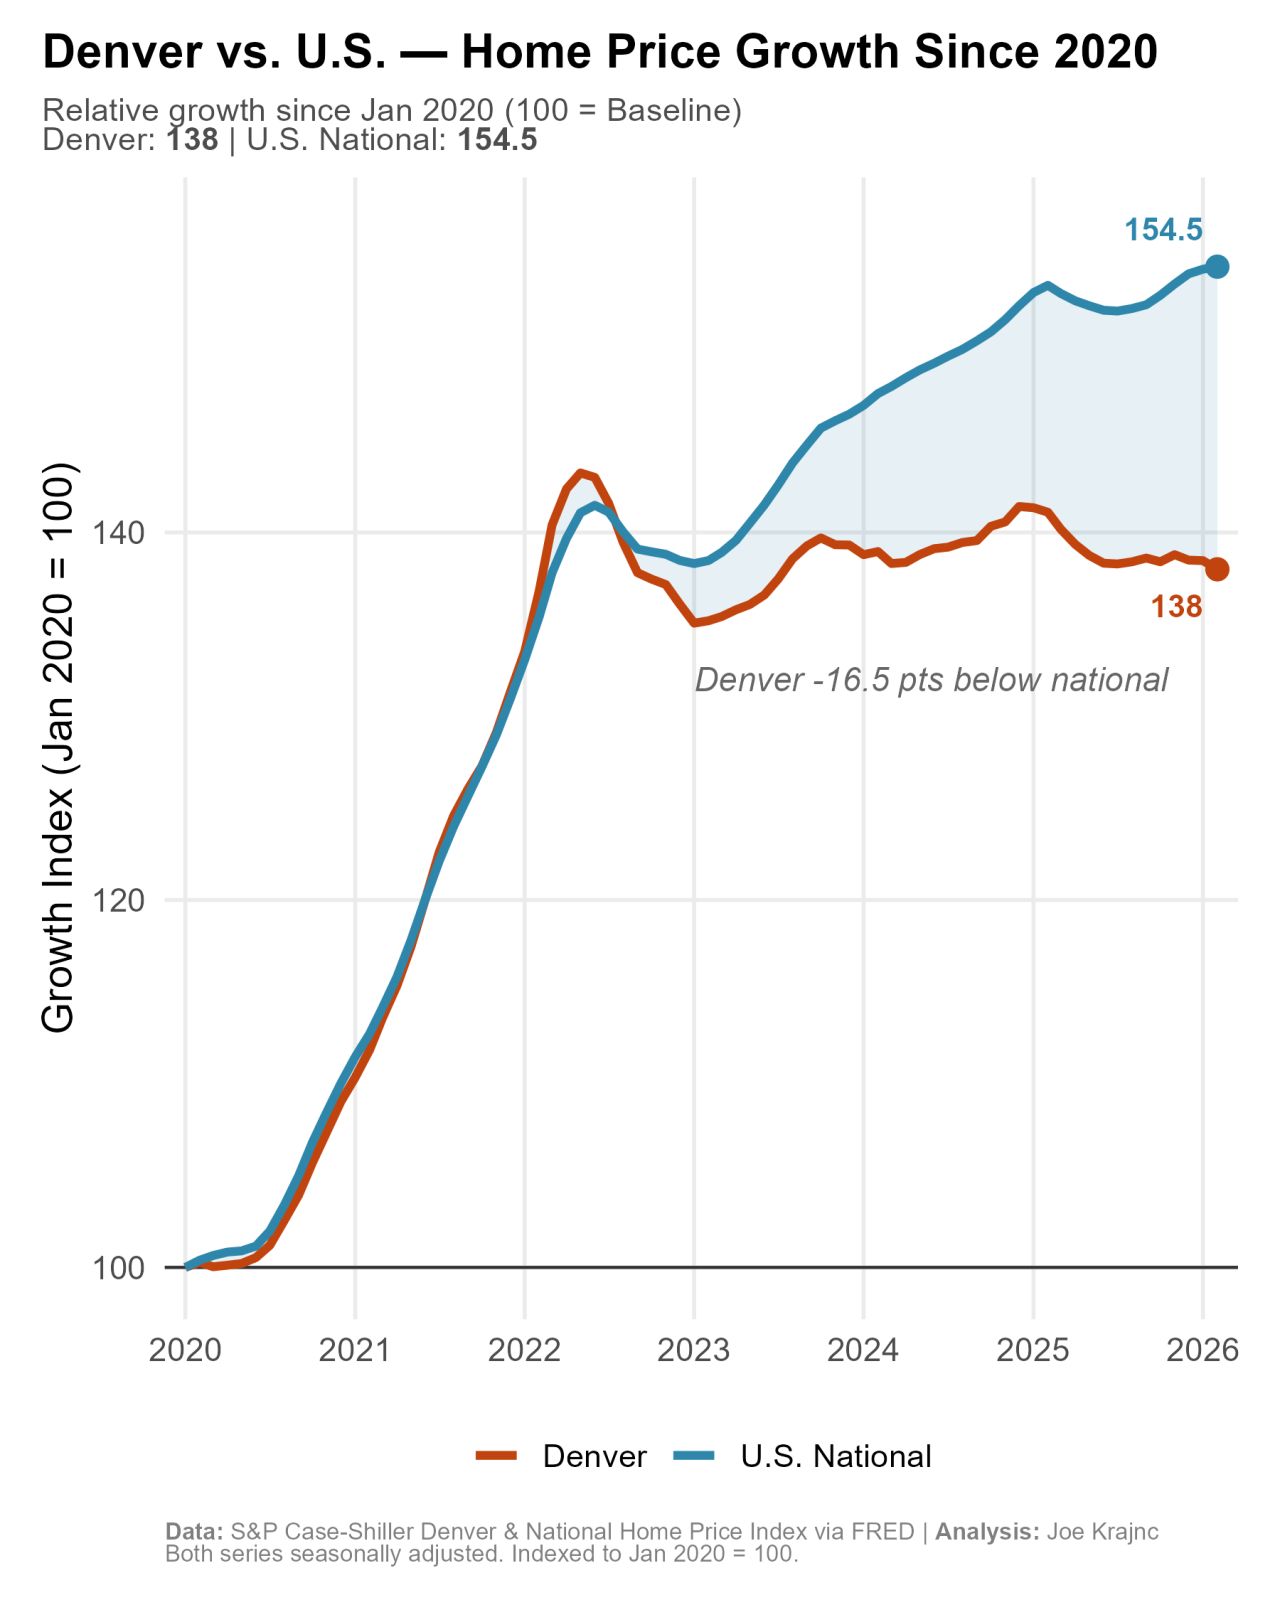
Sounds impressive — until you compare it to the national average. The U.S. as a whole is up +54.5% over the same period. That’s a
With March 2026 data now in, pending home sales — a leading indicator of buyer demand — tell an interesting story. Denver sits essentially flat
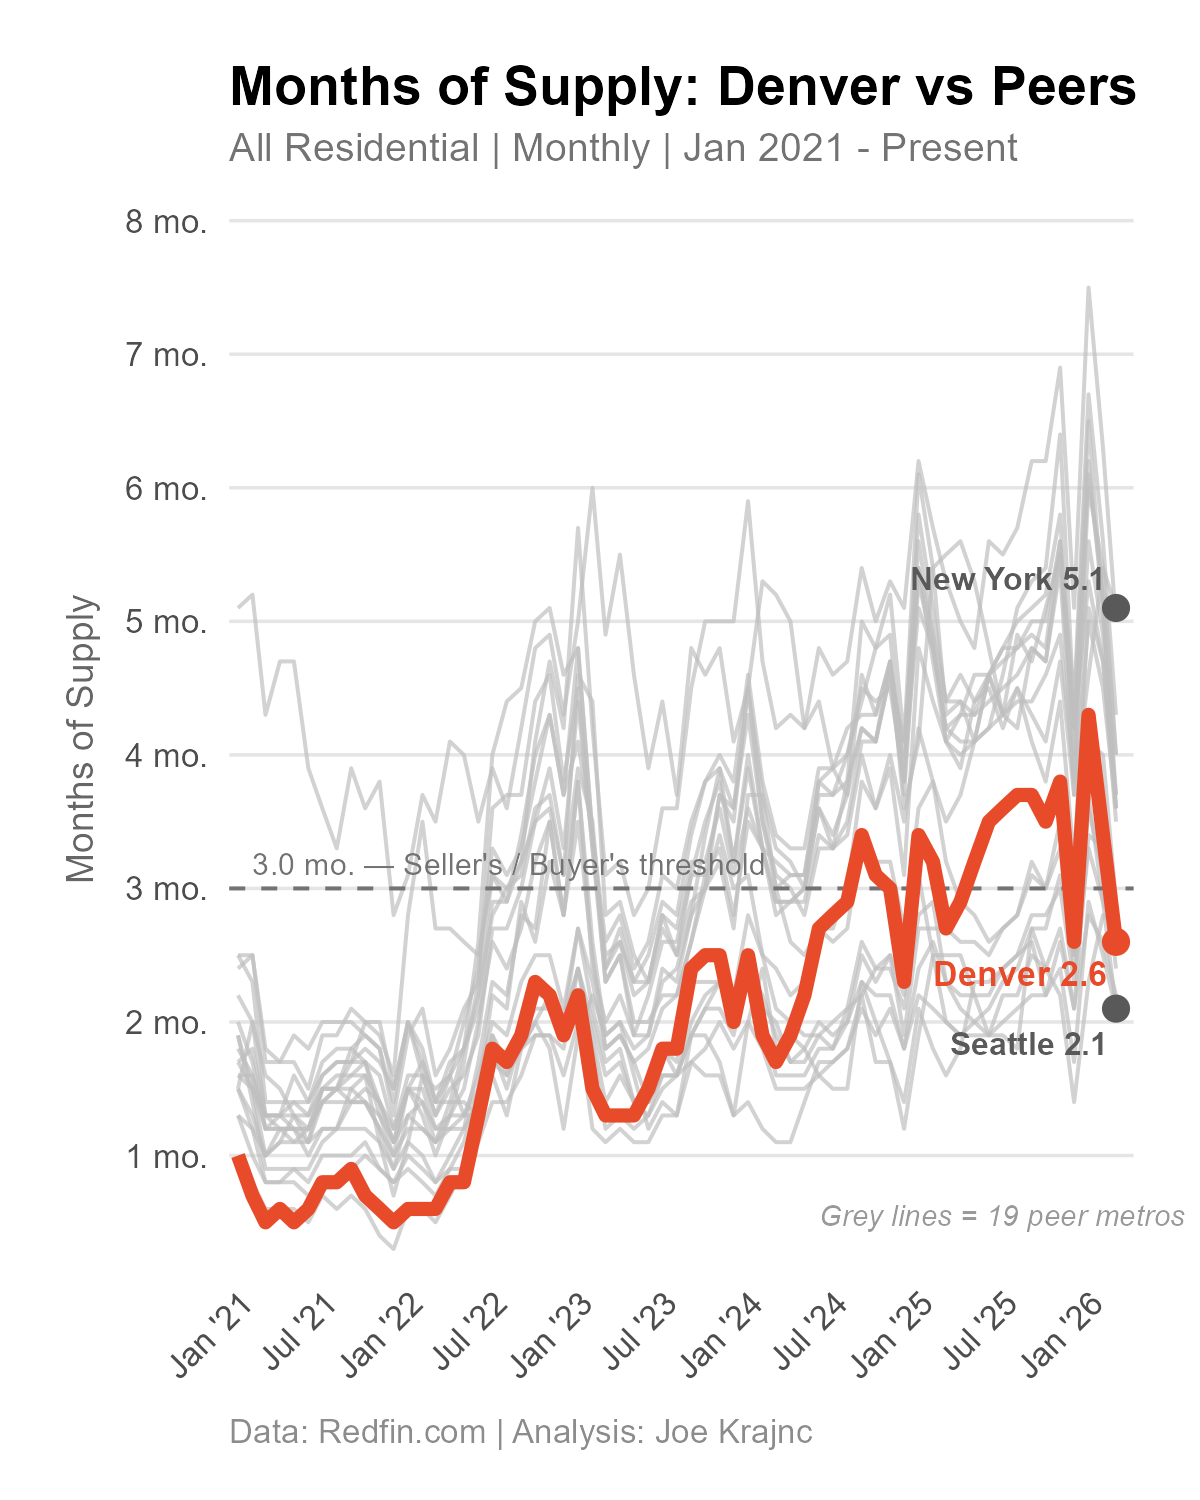
I pulled Months of Supply data for the 20 largest U.S. metros and ran the numbers for March 2026. Denver comes in at 2.6 months