The Colorado unemployment rate rose to 4.4% in October, 0.3 points above the national rate of 4.1%. That’s a gap we haven’t seen since November 2021.
The state also lost 5,700 jobs in October, and over the past year Colorado job growth has run at about half the national pace. Here’s what the latest data shows, and why it matters for the South Metro Denver housing market.
October at a glance (seasonally adjusted):
- Unemployment: 4.4% in Colorado vs 4.1% nationally
- Colorado’s rate jumped 0.3 points in one month, while the U.S. rate fell 0.1 points
- Colorado lost 5,700 nonfarm payroll jobs
- Job growth over the past year: 0.3% in Colorado vs 0.6% nationally (per CDLE)
Colorado unemployment rate is now above the U.S.
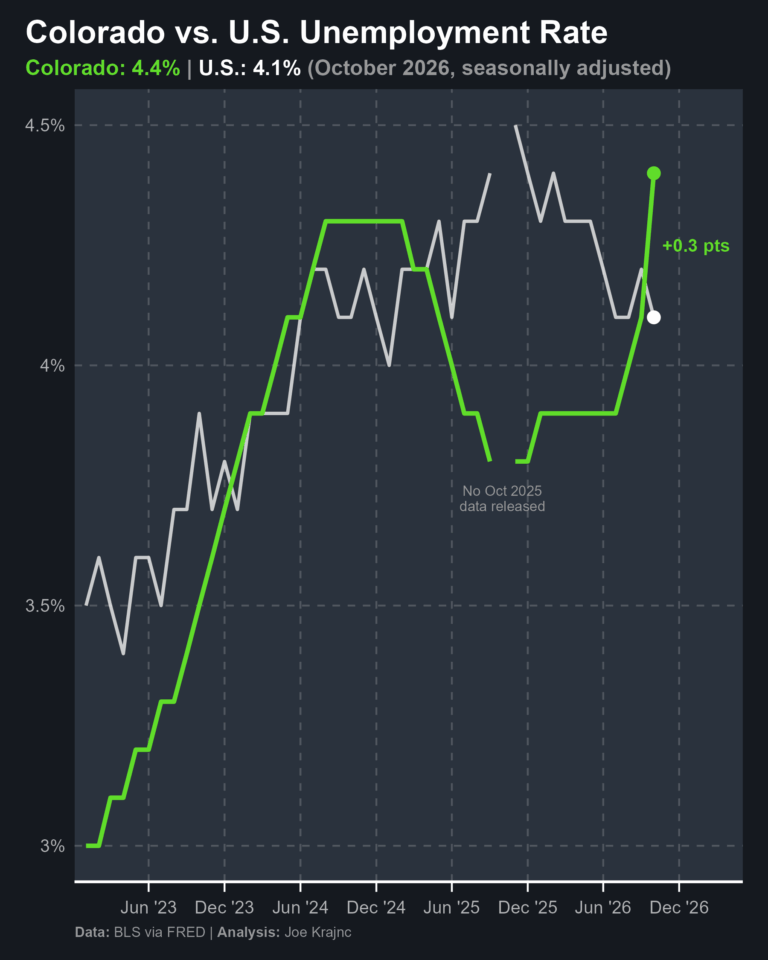
One month doesn’t make a trend, but this one has been building for a while. Since early 2023, Colorado’s unemployment rate has climbed from about 3.0% to 4.4%. The U.S. rate rose about 0.6 points over the same stretch.
Colorado went from having one of the tighter job markets in the country to running looser than the nation. The state briefly crossed above the U.S. rate in 2024 and early 2025, then fell back below it. October puts it back above, by the widest margin since November 2021.
The gap in both lines in late 2025 is the October 2025 federal government shutdown, when BLS did not release data for that month.
Where October’s jobs were lost
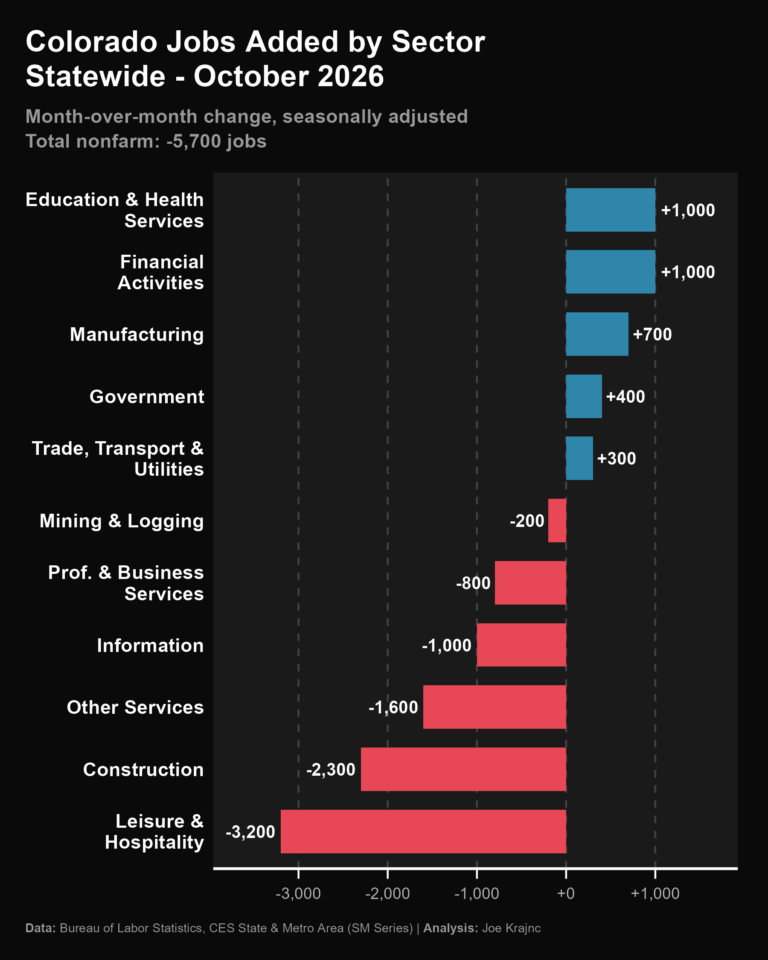
Colorado’s 5,700-job loss was concentrated in a few sectors:
- Biggest losses: Leisure & Hospitality (-3,200), Construction (-2,300), Other Services (-1,600), Information (-1,000)
- Biggest gains: Education & Health Services (+1,000), Financial Activities (+1,000), Manufacturing (+700)
The construction decline is the one to watch for housing. Construction jobs tend to track building activity, and a drop of 2,300 in one month was the second-largest decline of any sector.
These are seasonally adjusted figures, so normal seasonal swings, like the end of summer hiring, are already taken out.
Fewer Coloradans are working or looking for work
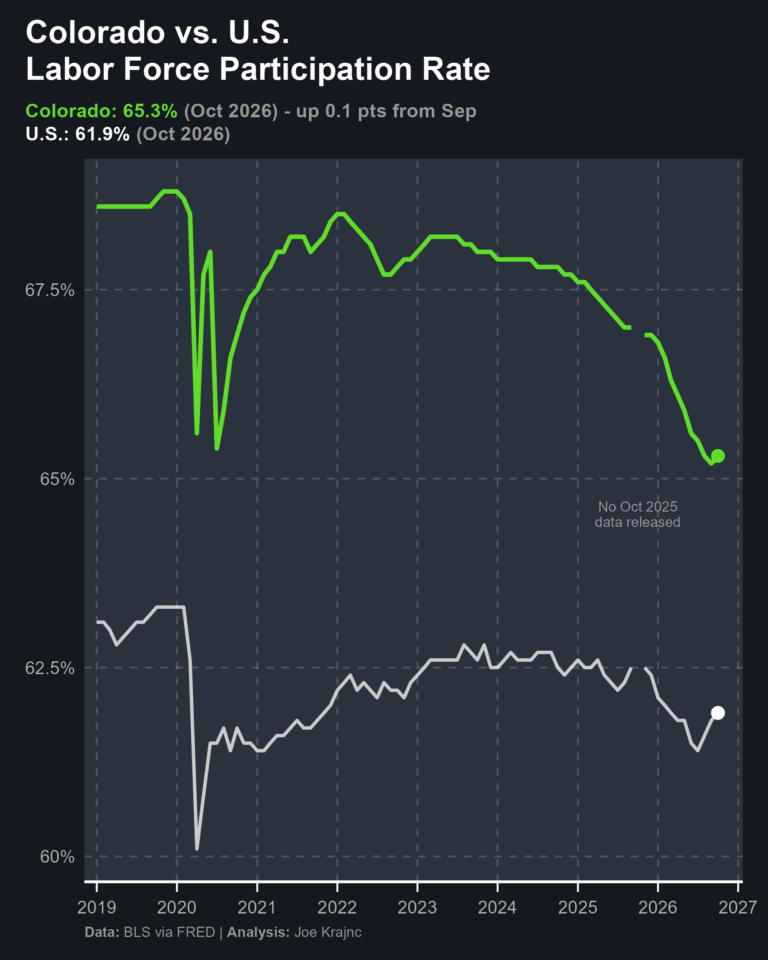
The picture gets worse when you look at the state participation rate. Colorado’s labor force participation rate has dropped 3.2 points since January 2022, from 68.5% to 65.3%. Over the same period, the U.S. rate fell just 0.3 points, from 62.2% to 61.9%.
That means fewer people are working or looking for work, and unemployment is still rising. Normally, people leaving the labor force pushes the unemployment rate down, because they’re no longer counted as unemployed. Colorado’s rate is rising anyway.
Participation did tick up 0.1 points in October, so part of last month’s unemployment jump is likely more people re-entering the job search. But a 0.1-point rise in participation doesn’t explain a 0.3-point rise in unemployment.
Colorado still has a higher participation rate than the nation as a whole. It’s the speed of the decline that stands out.
What it means for South Metro Denver housing
I watch this as a REALTOR because housing demand follows jobs. A cooling local job market usually shows up in fewer competing offers and longer days on market before it shows up in prices.
- For buyers: a softer job market tends to mean less competition and more room to negotiate on price, repairs and concessions.
- For sellers: pricing and presentation matter more. Homes that are priced right and well prepared still sell; homes that aren’t tend to sit.
If you’re thinking about buying or selling in Highlands Ranch or the South Metro area and want to know how this applies to your neighborhood, I’m happy to walk through the local numbers with you.
A word of caution, and what’s next
One month of state data is noisy. State payroll estimates come from a survey sample, and BLS revises them every March when it benchmarks to more complete records. The longer trends in the unemployment and participation charts are the stronger signal.
November data comes out on December 18, 2026. I’ll be watching whether Colorado’s unemployment rate stays above the national rate.
Data sources
- Unemployment rate: BLS Local Area Unemployment Statistics, via FRED: Colorado (COUR) and U.S. (UNRATE)
- Labor force participation rate: BLS, via FRED: Colorado (LBSSA08) and U.S. (CIVPART)
- Jobs by sector: BLS Current Employment Statistics, State and Metro Area (seasonally adjusted)
- Year-over-year job growth: Colorado Department of Labor and Employment, October 2026 Employment Situation release
All figures are seasonally adjusted. Analysis by Joe Krajnc.