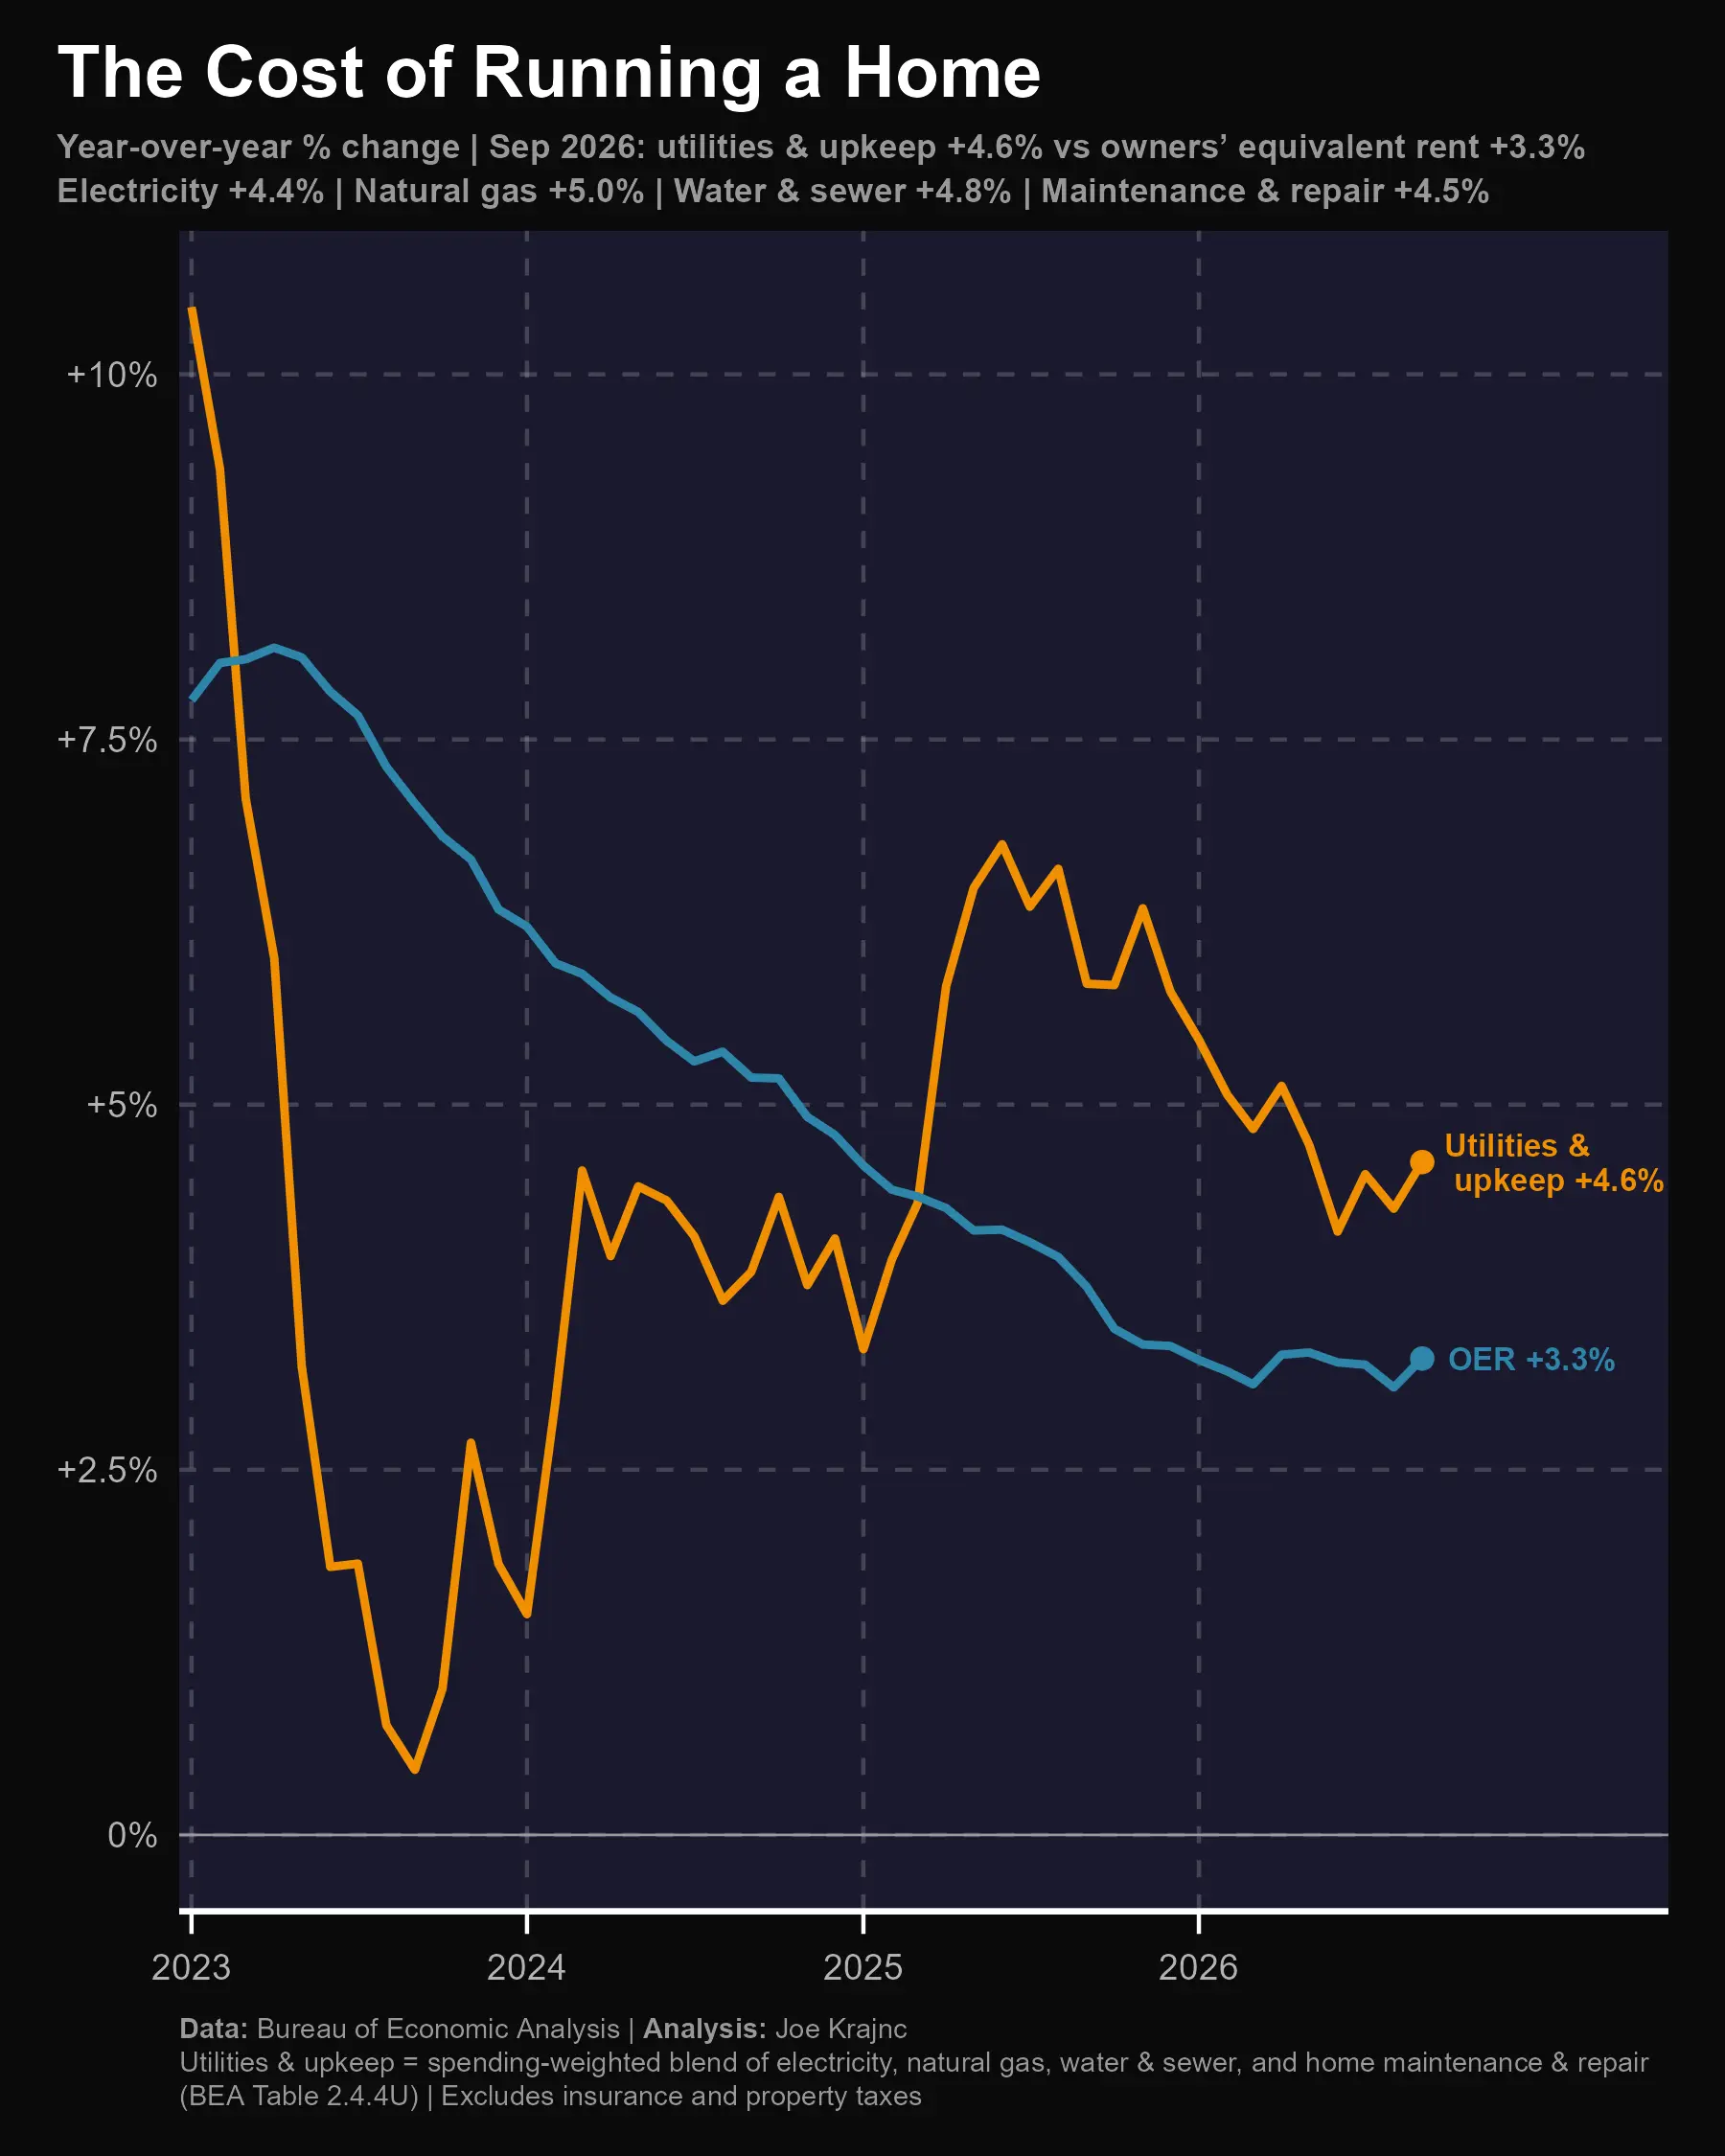
About three-quarters of the housing figure in September’s PCE report, the Fed’s preferred inflation gauge, is owners’ equivalent rent (OER). It’s an estimate of what owners would pay to rent their own home. Nobody actually writes that check. It’s up 3.3% from a year ago.
What homeowners actually pay
The bills owners do pay – electricity, natural gas, water and sewer, and home repairs – are up 4.6%. That spending has outpaced OER for 18 straight months, every month since April 2025. It’s also running ahead of overall PCE inflation (+3.6%).
| Measure (Sept 2026, year over year) | Change |
|---|---|
| Owners’ equivalent rent | +3.3% |
| Overall PCE inflation | +3.6% |
| Utilities & upkeep | +4.6% |
Why OER is the number in the headlines
OER is estimated from rents, which is why “housing inflation” tracks the rental market so closely. As rent growth has slowed, the headline housing number has slowed with it. But a homeowner with a fixed-rate mortgage doesn’t feel rent. They feel the utility bill and the repair invoice.
Will it last?
Energy is the main driver, so this can swing with fuel prices. Before 2021, these costs usually ran below rent. For anyone budgeting for homeownership today, though, the costs that come after the mortgage are rising faster than the housing number in the headlines.
What’s not included
Homeowners insurance and property taxes aren’t part of this comparison. For many Colorado owners, those are the bigger story. More on them soon.
Data: Bureau of Economic Analysis (Table 2.4.4U) | Analysis: Joe Krajnc, Chair, SMDRA Statistics Committee.